Overview
1. Vessel search
Search by either vessel name or IMO. Click a vessel from the list to select it
- Type to view a list of filtered vessels
- Displays partial matches or vessel names or IMOs
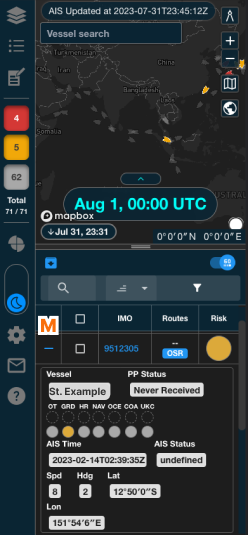
2. Side menu
Select content to display on the map
| No. | Icon | Name | Description |
|---|---|---|---|
| a. |  |
Layer menu | Select layers to display |
| b. |  |
Legend | View symbol information for items displayed on the map |
| c. |  |
Rolling risk inputs | Open the Rolling Risk Chart table to edit values |
a. Layer menu
Select which layers are displayed on the map. Toggle all layers in a category On / Off with the "All" checkbox.
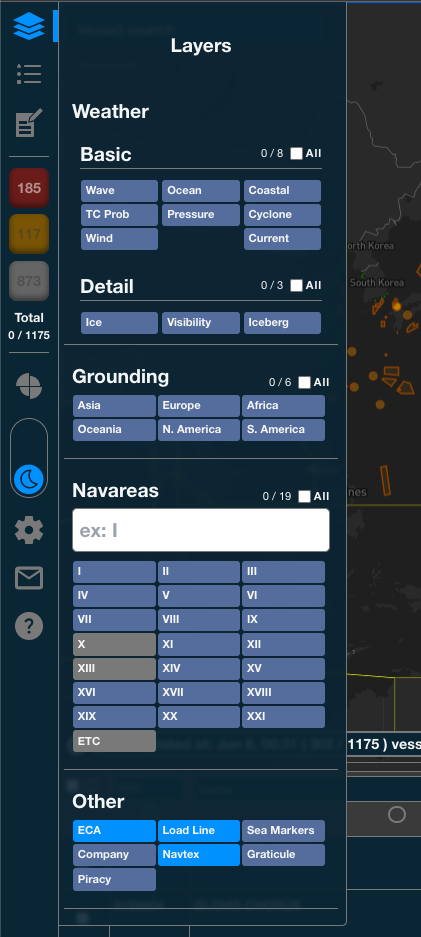
- Weather
- Basic
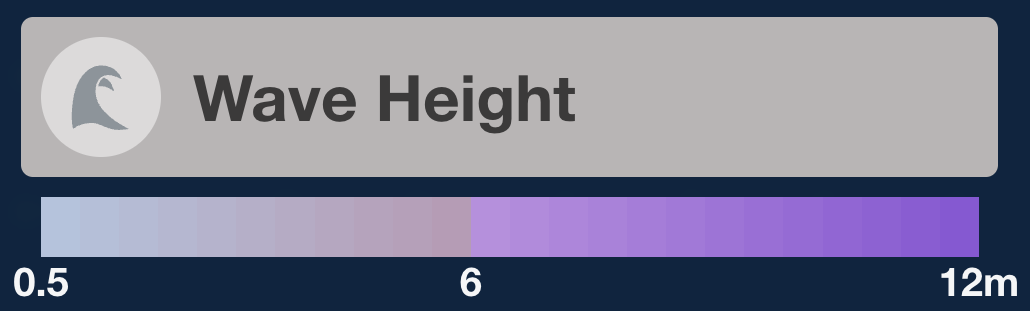
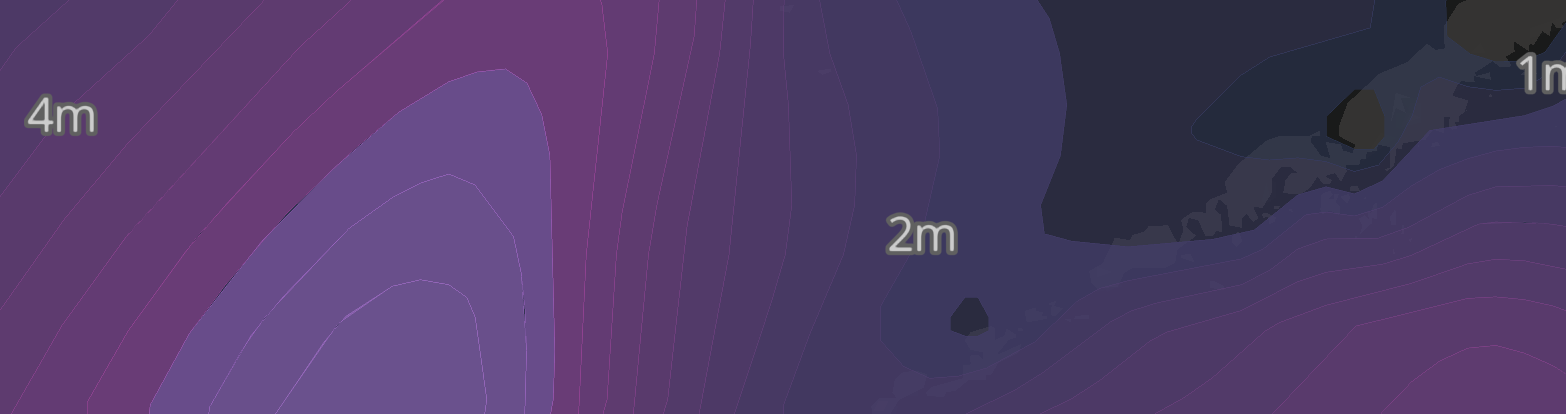
- Wave: Wave Height
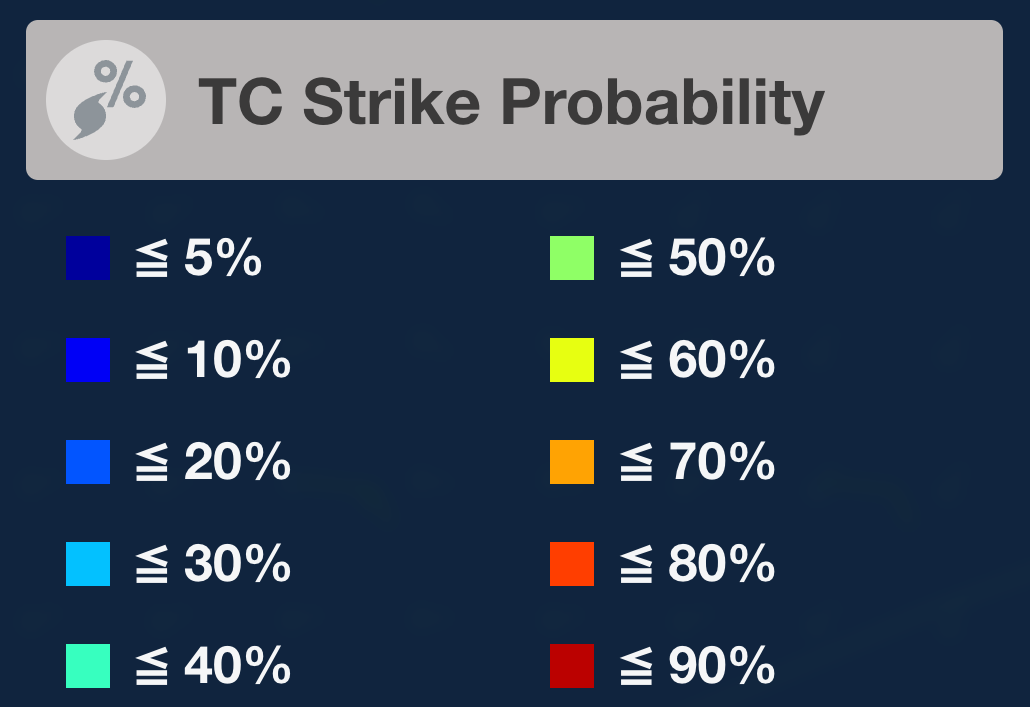
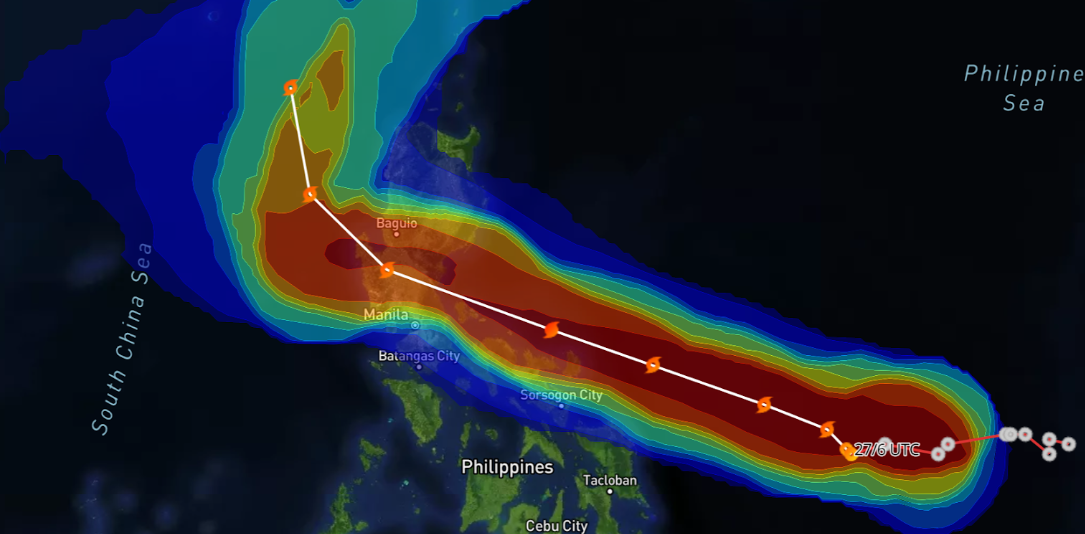
- TC Prob: Tropical Cyclone Strike Probability
- Cyclone: Cyclone Paths
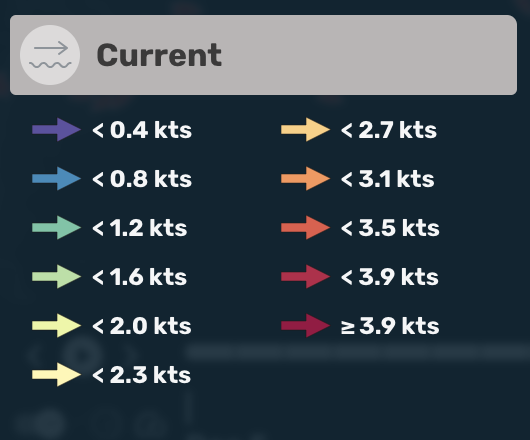
- Current: Ocean Currents
- Ocean: Ocean Storm Info
- Coastal: Coastal Storm Info
- Pressure: Pressure Pattern (Isobars)
- Wind: Wind
- Detail
- Ice: Sea Ice Concentration
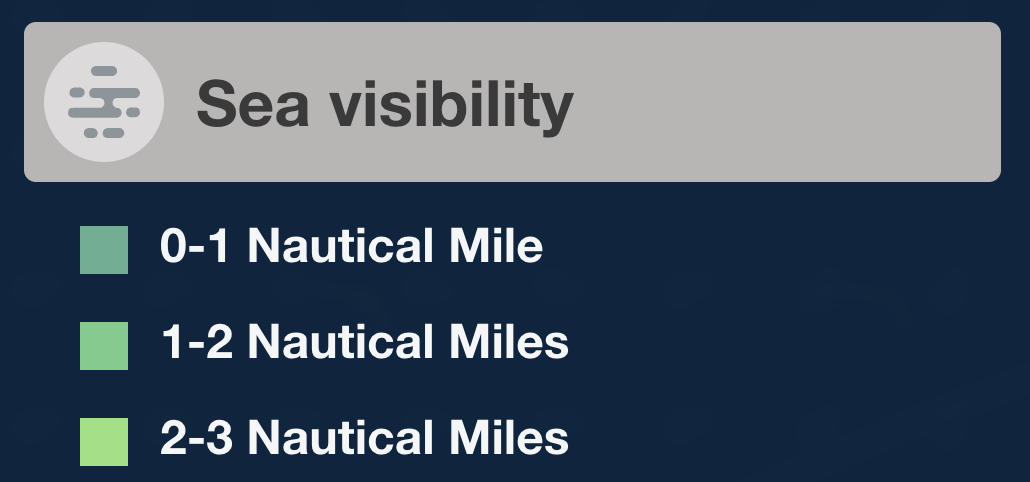
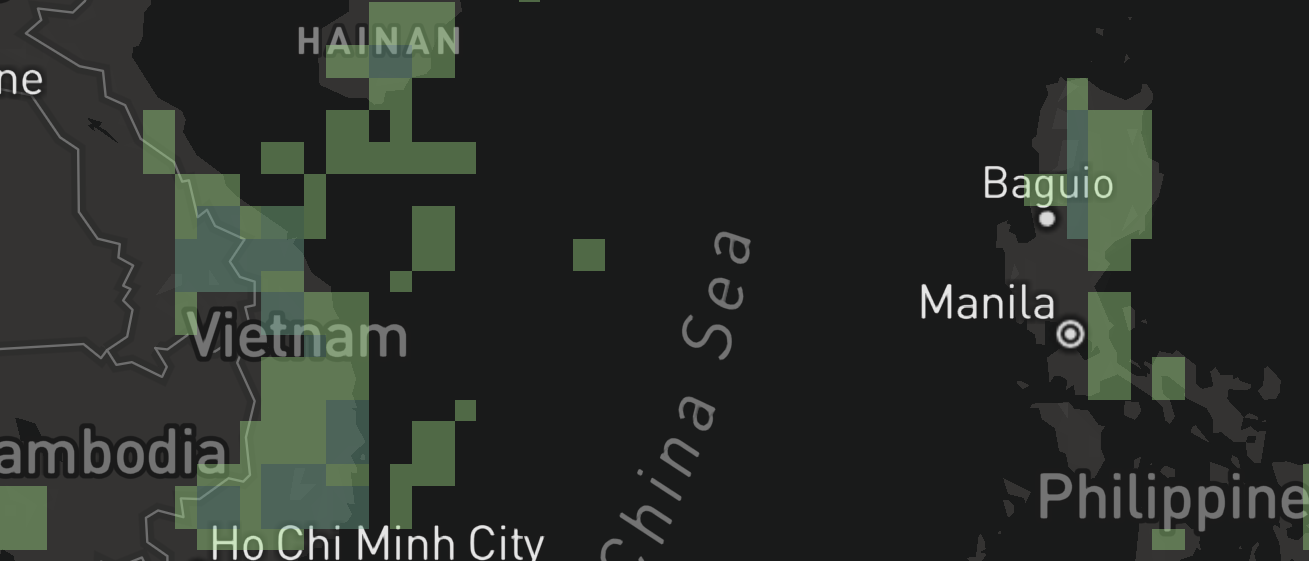
- Visibility: Sea Visibility
- Iceberg: Iceberg Density
- Grounding: 20m Water Depth Areas
- Navareas: Navigation Warning Areas (21 areas + ETC - other)
- Other
- ECA: ECA (Emission Control Areas)
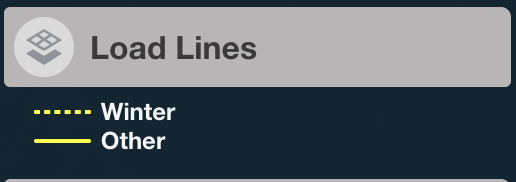
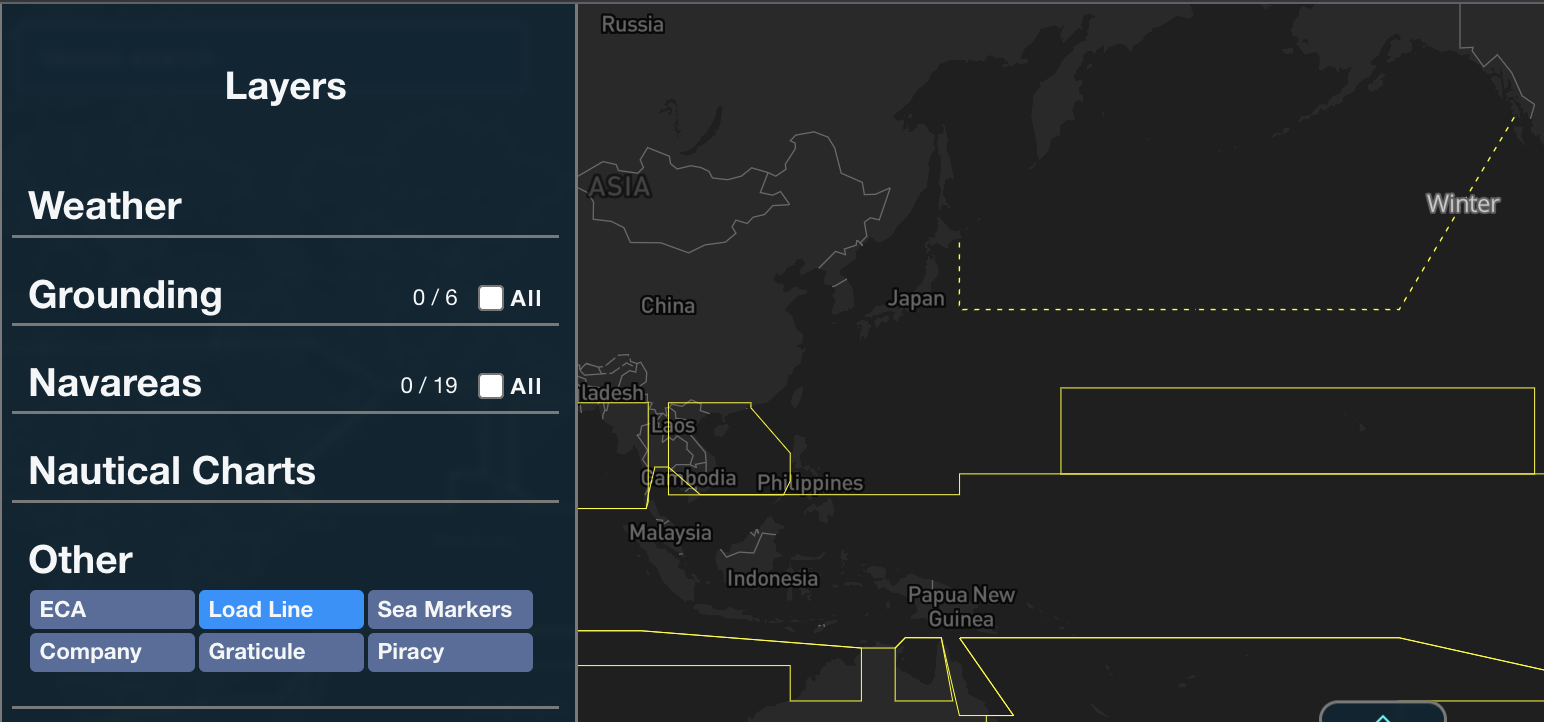
- Load Line: Load line zones
- Sea Markers: Various Nautical Chart-type markers -- lighthouses, approaches, etc. (Visible from zoom level 7 and up)
- Company: Company Areas
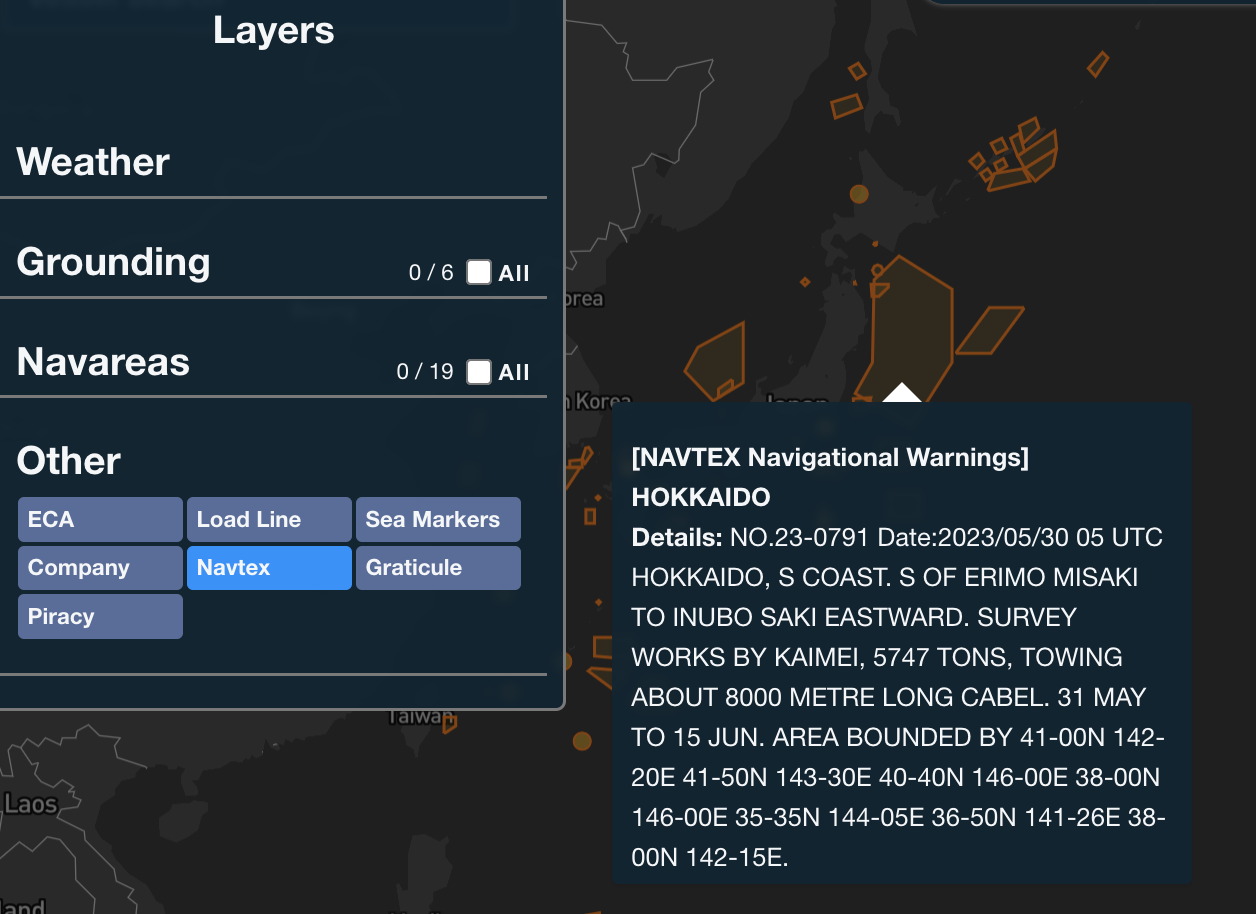
- Navtex: NAVTEX navigational warning areas for the 5 Japanese sea areas (updated hourly)
- Graticule: Graticule grid
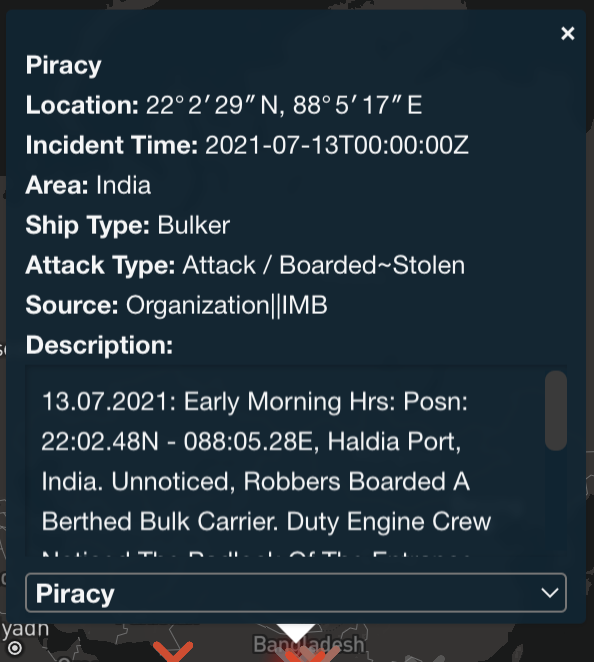
- Piracy: Piracy Incidents
- AIS Depth: Depth data around the current vessel position
- Route Depth: Depth data along the Passageplan
AIS Depth Details
AIS Depth data is displayed around the current vessel position. The depth data is displayed in meters, and is only displayed for depth data that is less than or equal to 50 meters.
Route Depth Details
Route Depth data is displayed as a buffer around the passageplan (if available). The depth data is displayed in meters, and is only displayed for depth data that is less than or equal to 50 meters.
NAVTEX Details
NAVTEX navigational warnings are globally standardized navigational warnings, and each country provides urgently needed information for safe navigation in coastal waters by an automatic reception system. In Japan, the coastal area is divided into five sea areas and the necessary information for each sea area is provided in Japanese and English. The areas are updated hourly on the map.
Company Area Data
Company Area data from before 2022 is now available in the map.
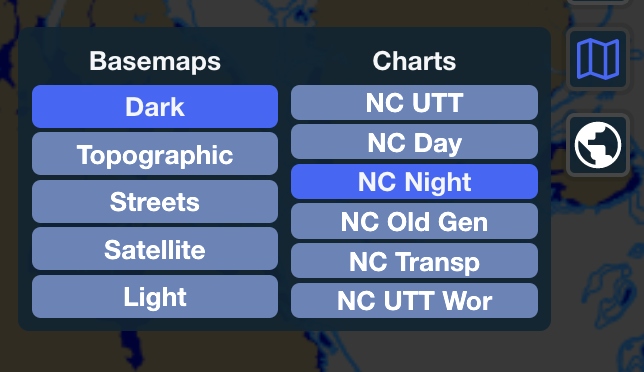
Nautical Charts Details
| Item | Content | Features | Use Case |
|---|---|---|---|
| Day/Night | Standard online nautical charts for displaying approximate depth info | Bathymetric contour info Data updates are less frequent than UTT Certain areas have more detailed info |
When only approximate depth is needed |
| UTT | An online nautical chart specifically for NAR service, which, in addition to depth data, displays additional chart data, and is updated with ENC level data | Provides the most detailed chart data, in addition to depth. The charts may display data which is being updated by the provider, however. | When desiring the most detailed info possible |
| UTT_WOR | A simplified UTT chart, showing only data necessary for actual voyage use | Since only basic depth data is displayed content which is being updated is not displayed | When grounding risk is the primary concern |
| Old Gen | The previous version of the UTT chart | Displays the previous version of the UTT chart | When desiring old chart data |
| Transp | A chart displaying only water depth | No land data is displayed | When needing satellite ground imagery |
Transas terms of use : link
UTT – is a collection based on agreements with Hydrographic agencies. These UTT tiles are built using our cartographic DB Unidata. The primary difference between TX97 and UTT is that the UTT-collection does not contain charts on internal waterways such as channels, rivers, and the like.
UTT tiles & UTT-WOR tiles. This is the same tile collection.
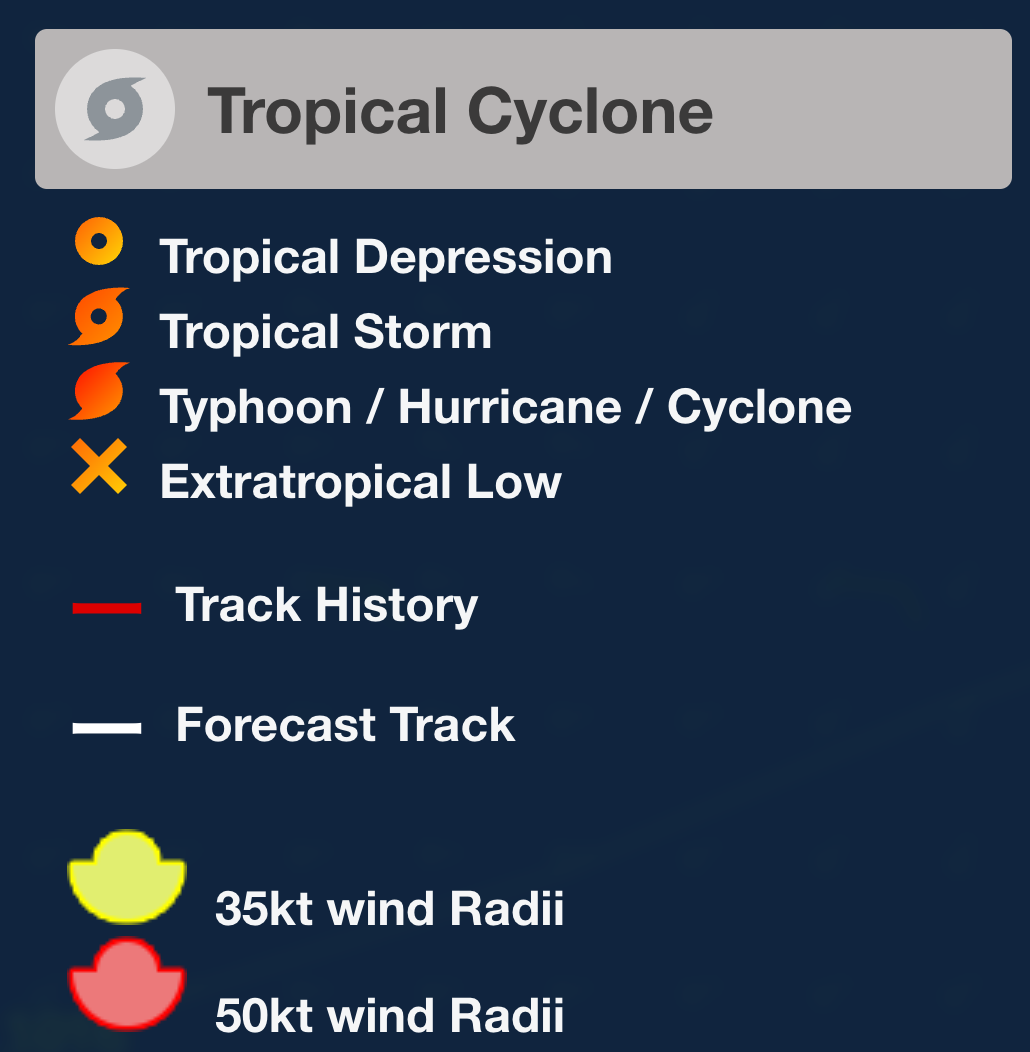
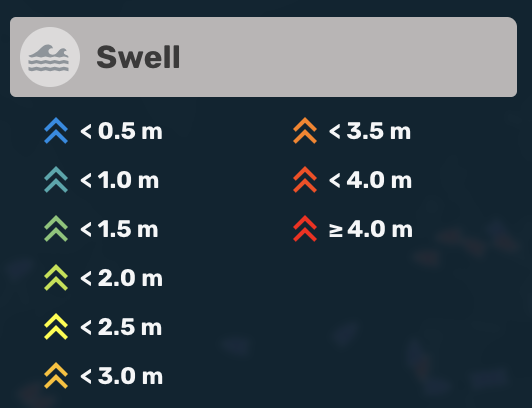
b. Legend
View layer symbol data for toggled layers in "a" (Layer menu)
| Legend | Sample |
|---|---|
 |
  |
 |
 |
 |
 |
 |
 |
 |
 |
 |
 |
 |
 |
 |
  |
 |
 |
| ECA | 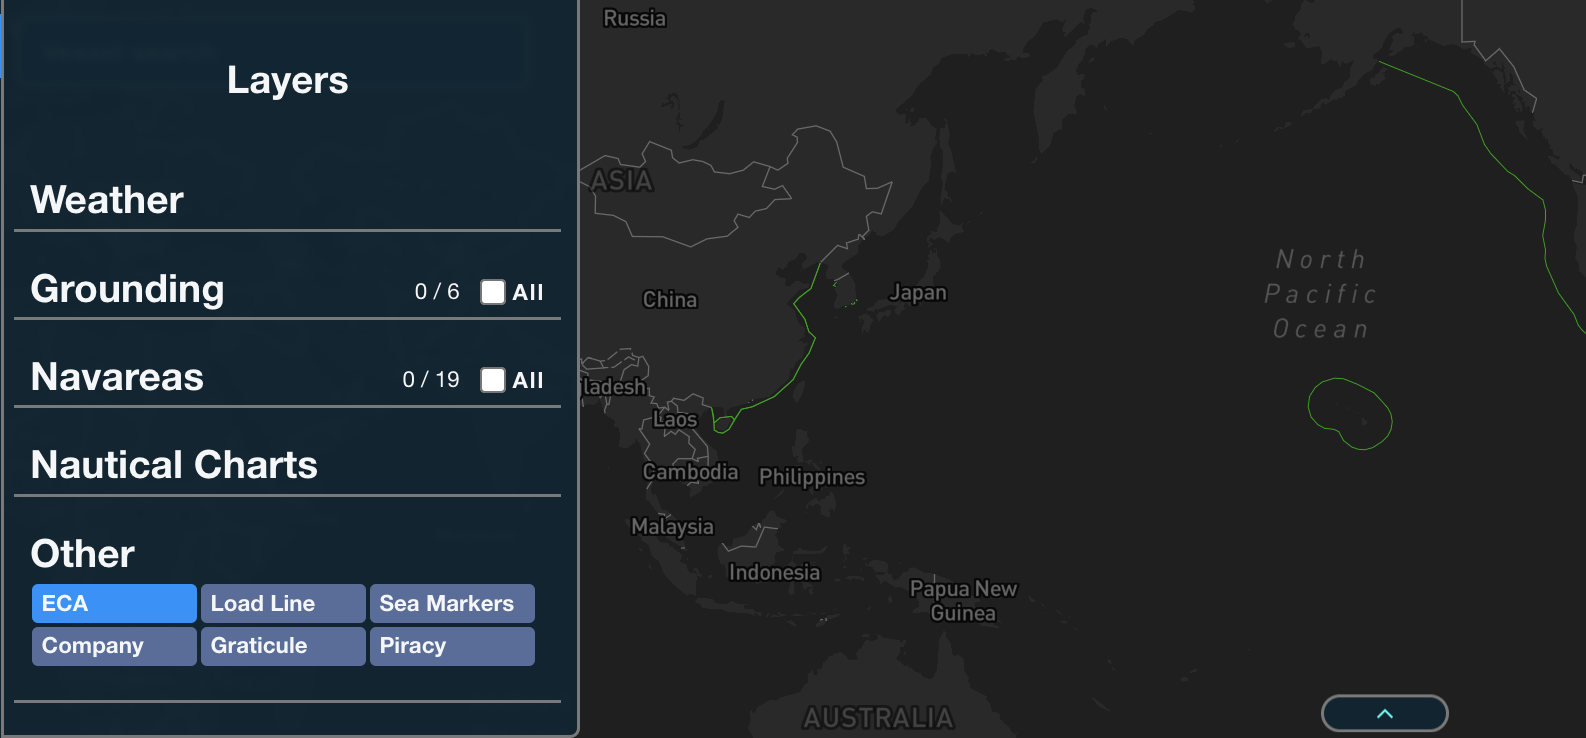 |
| Sea Markers | 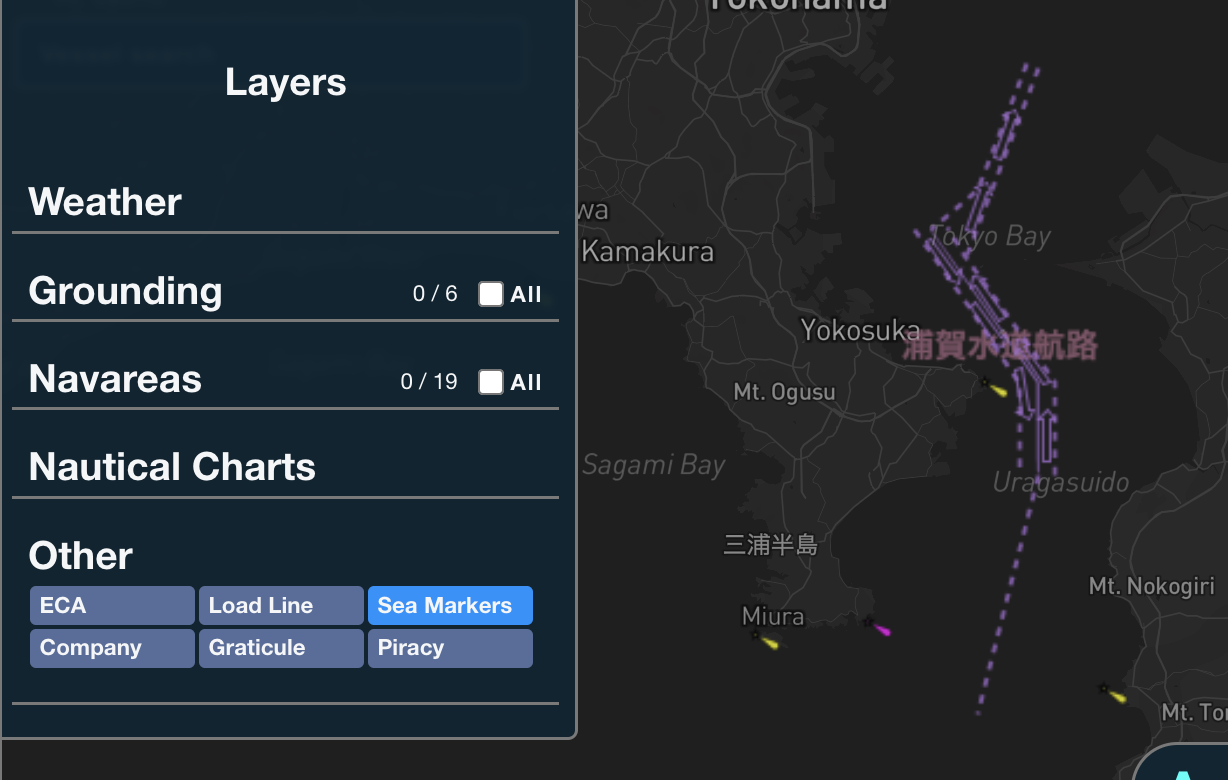 |
c. Rolling risk inputs
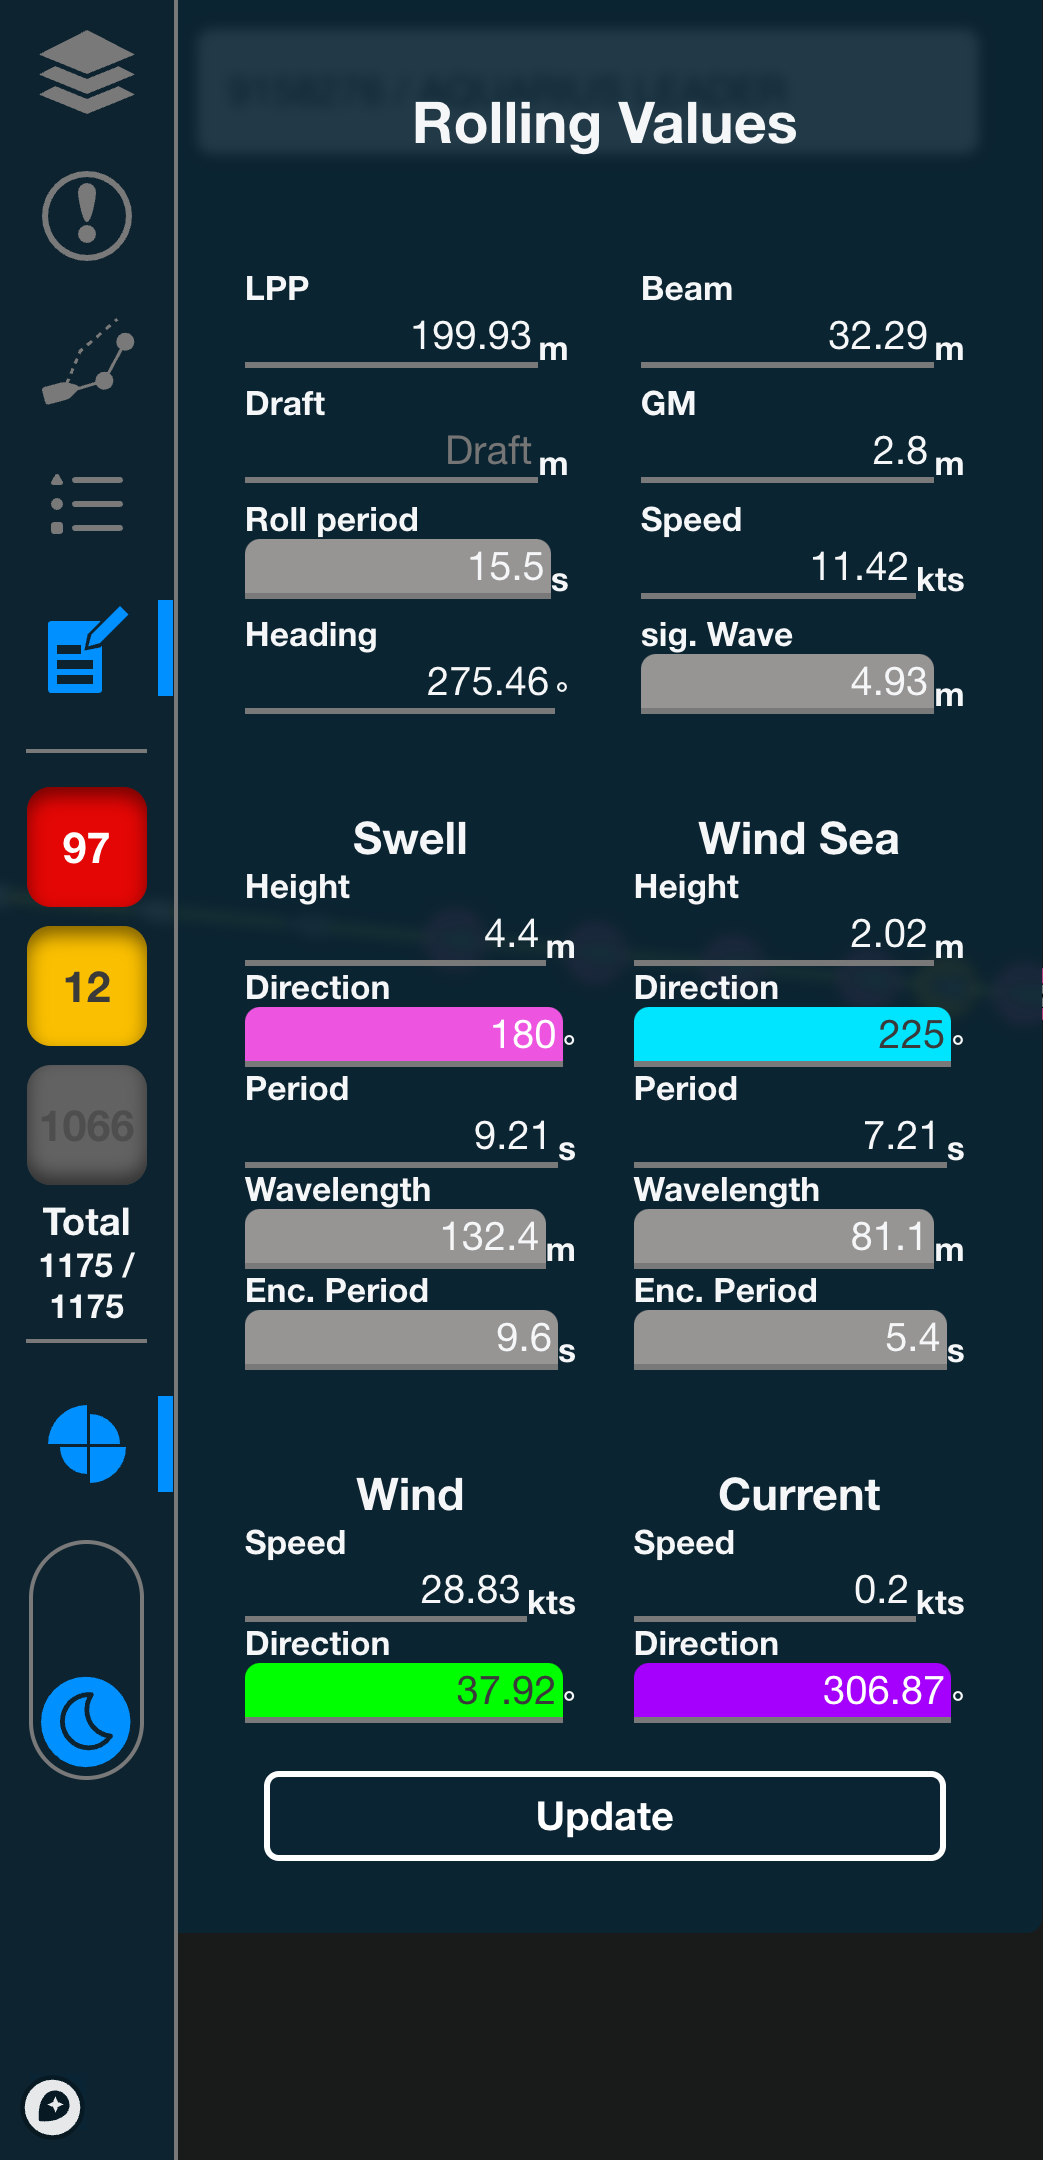
Input vessel and weather parameters to view calculated Rolling Risk and visualization.
Values are input automatically when a vessel is selected.
Changing the input values and clicking "Update" updates the rolling rose chart (About the Rolling Rose Chart)
Note
Please note that refreshing the screen or selecting a different vessel or simulation point will return the inputs to their original values.
Risk level filter
Toggle vessel display On / Off by risk level (>99nm, High, Medium, Low)
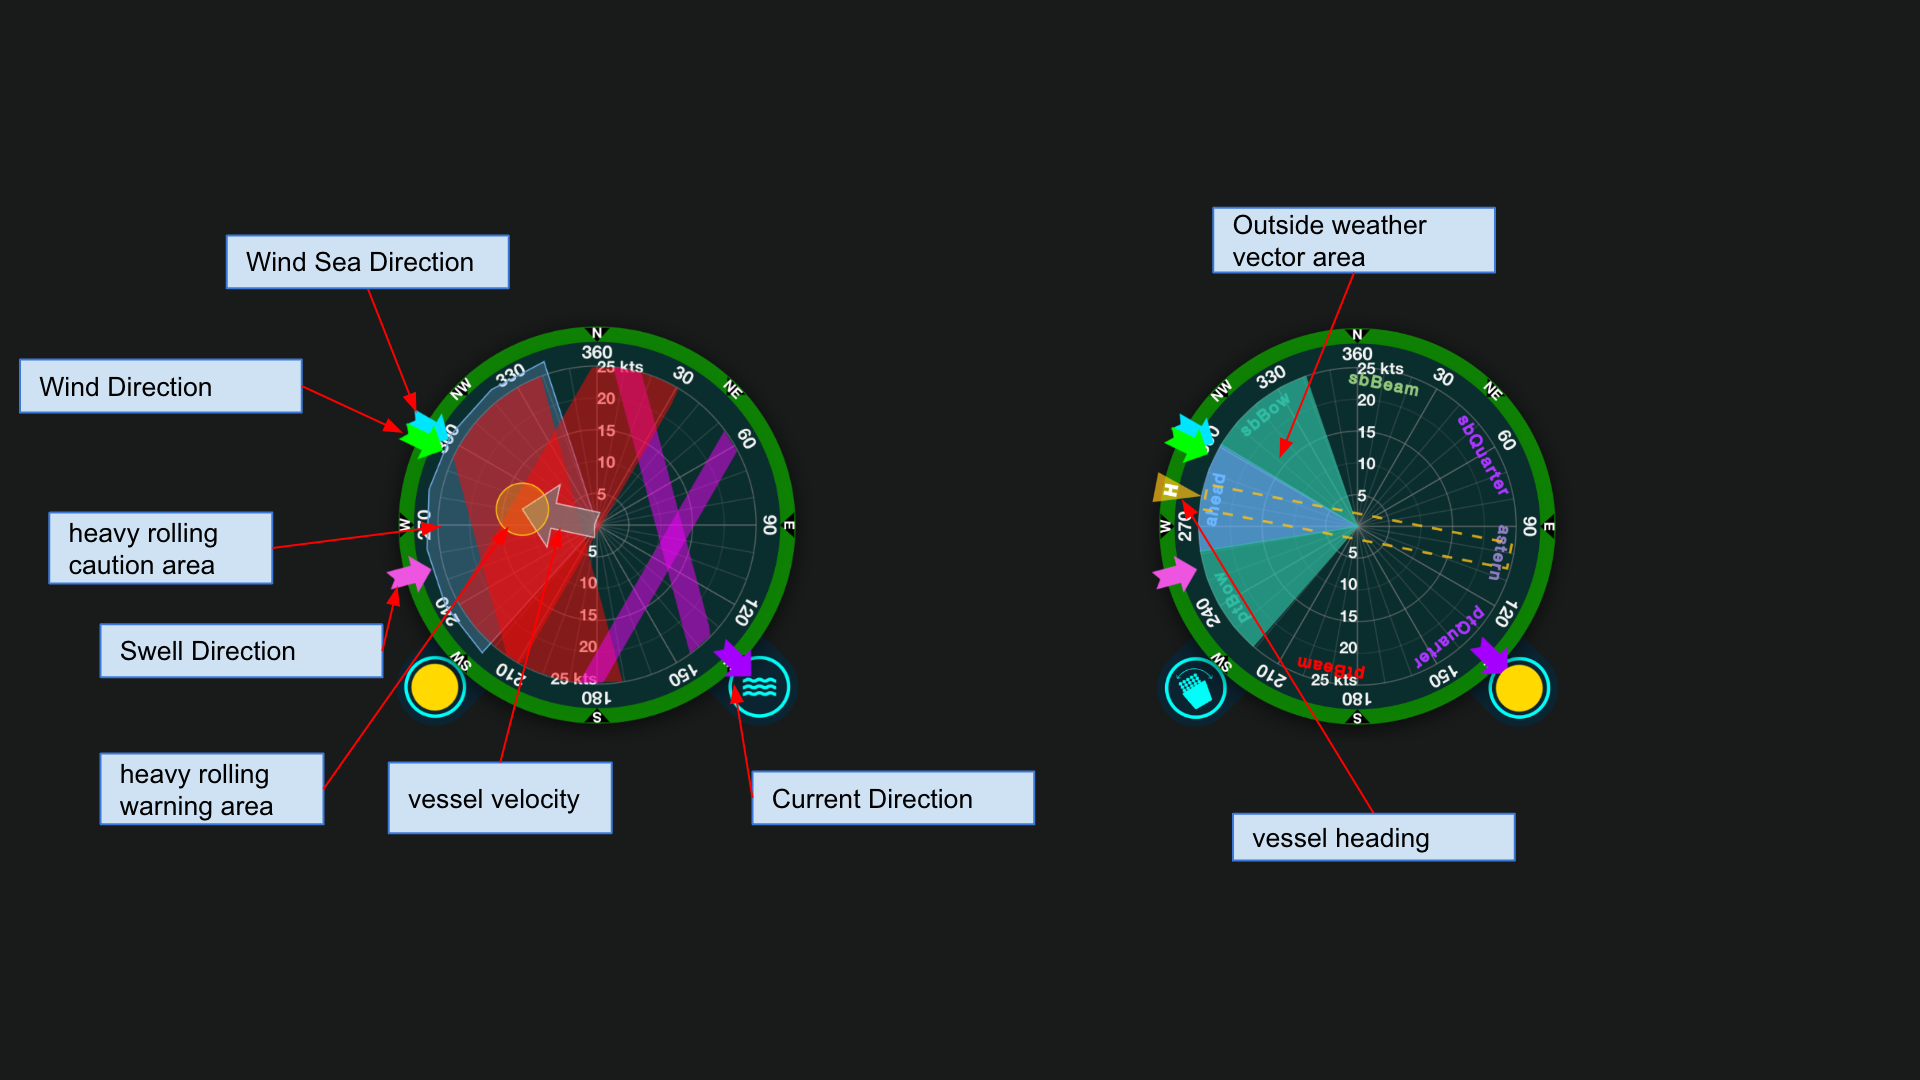
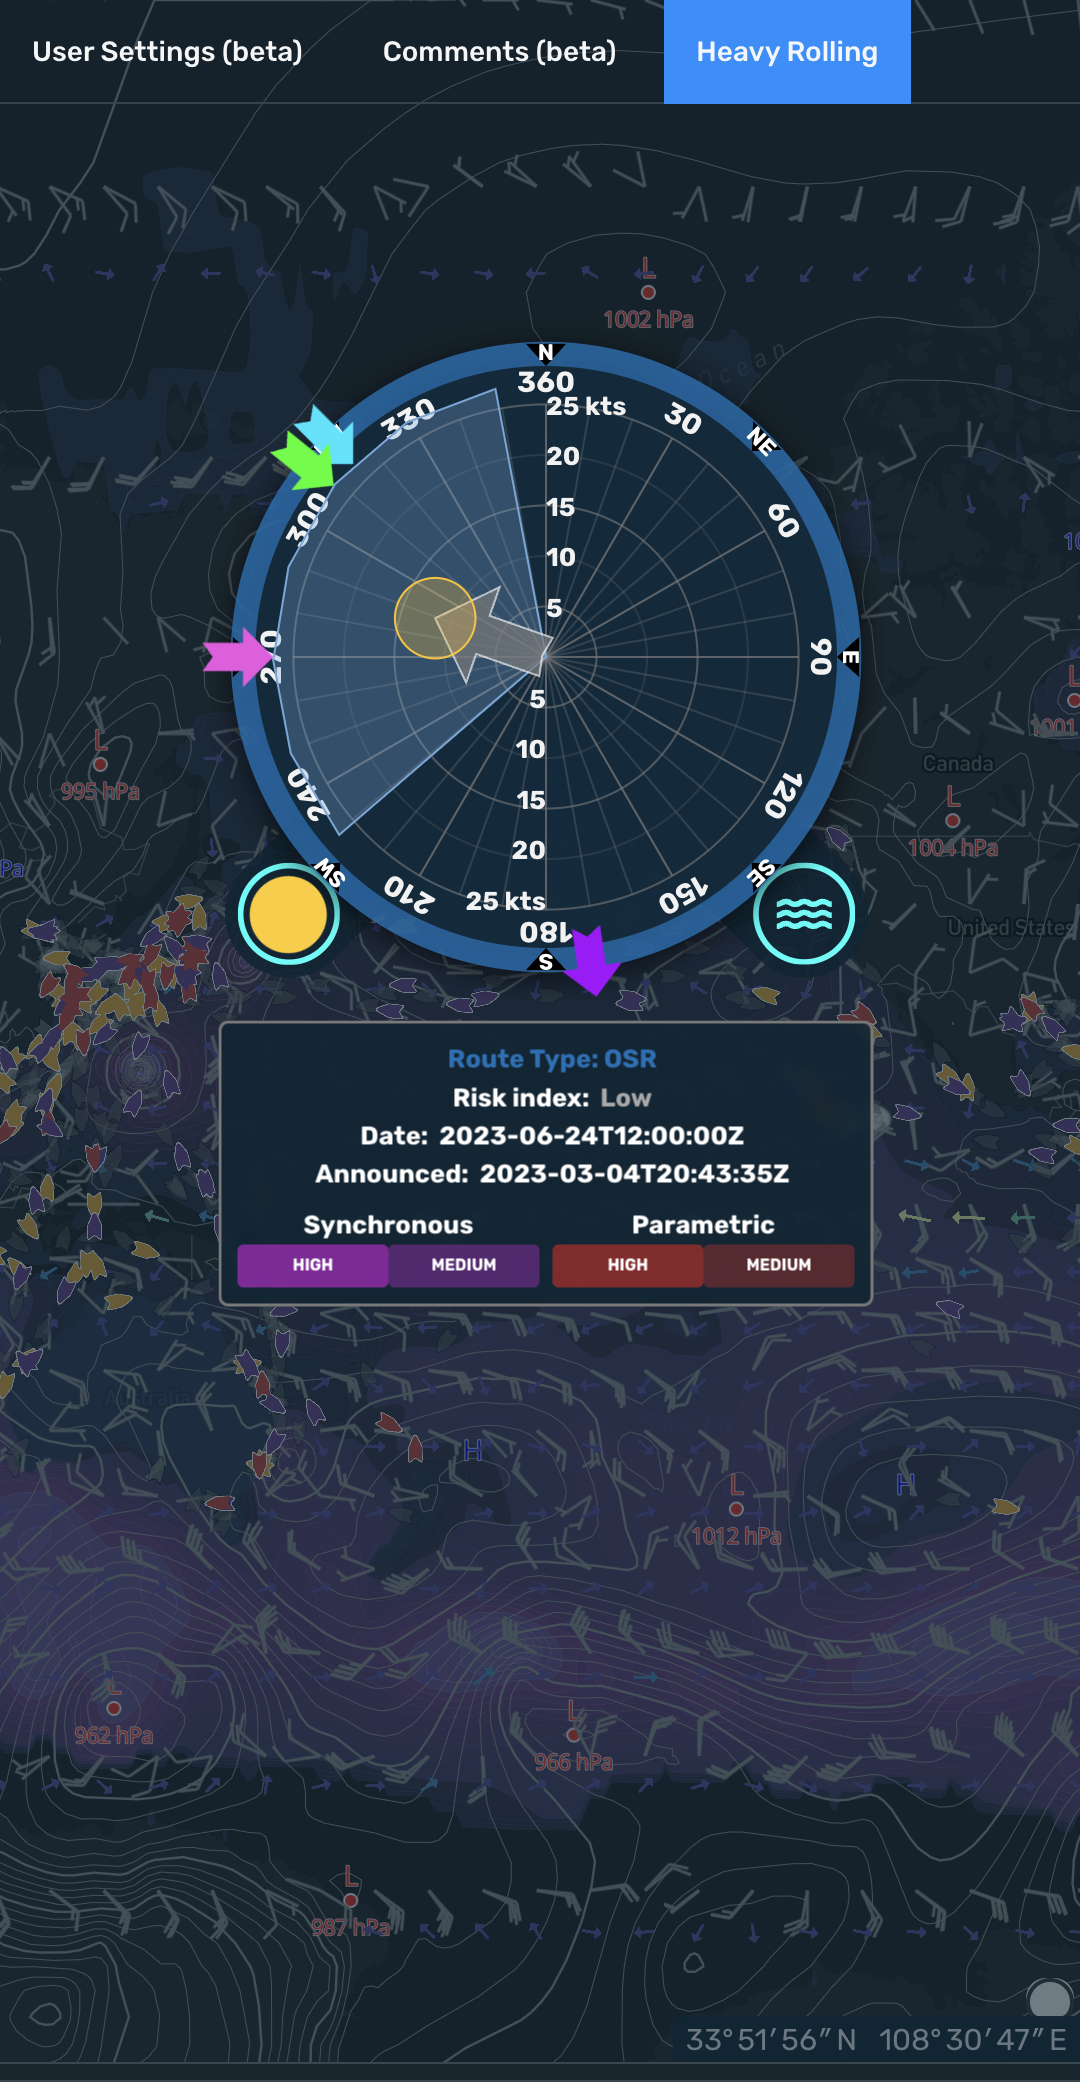
Rolling rose
View Synchronous / Parametric Rolling risk based on vessel speed & size, and weather data (wind wave & swell).
The outer ring changes color based on the selected route type. (Passageplan, OSR)
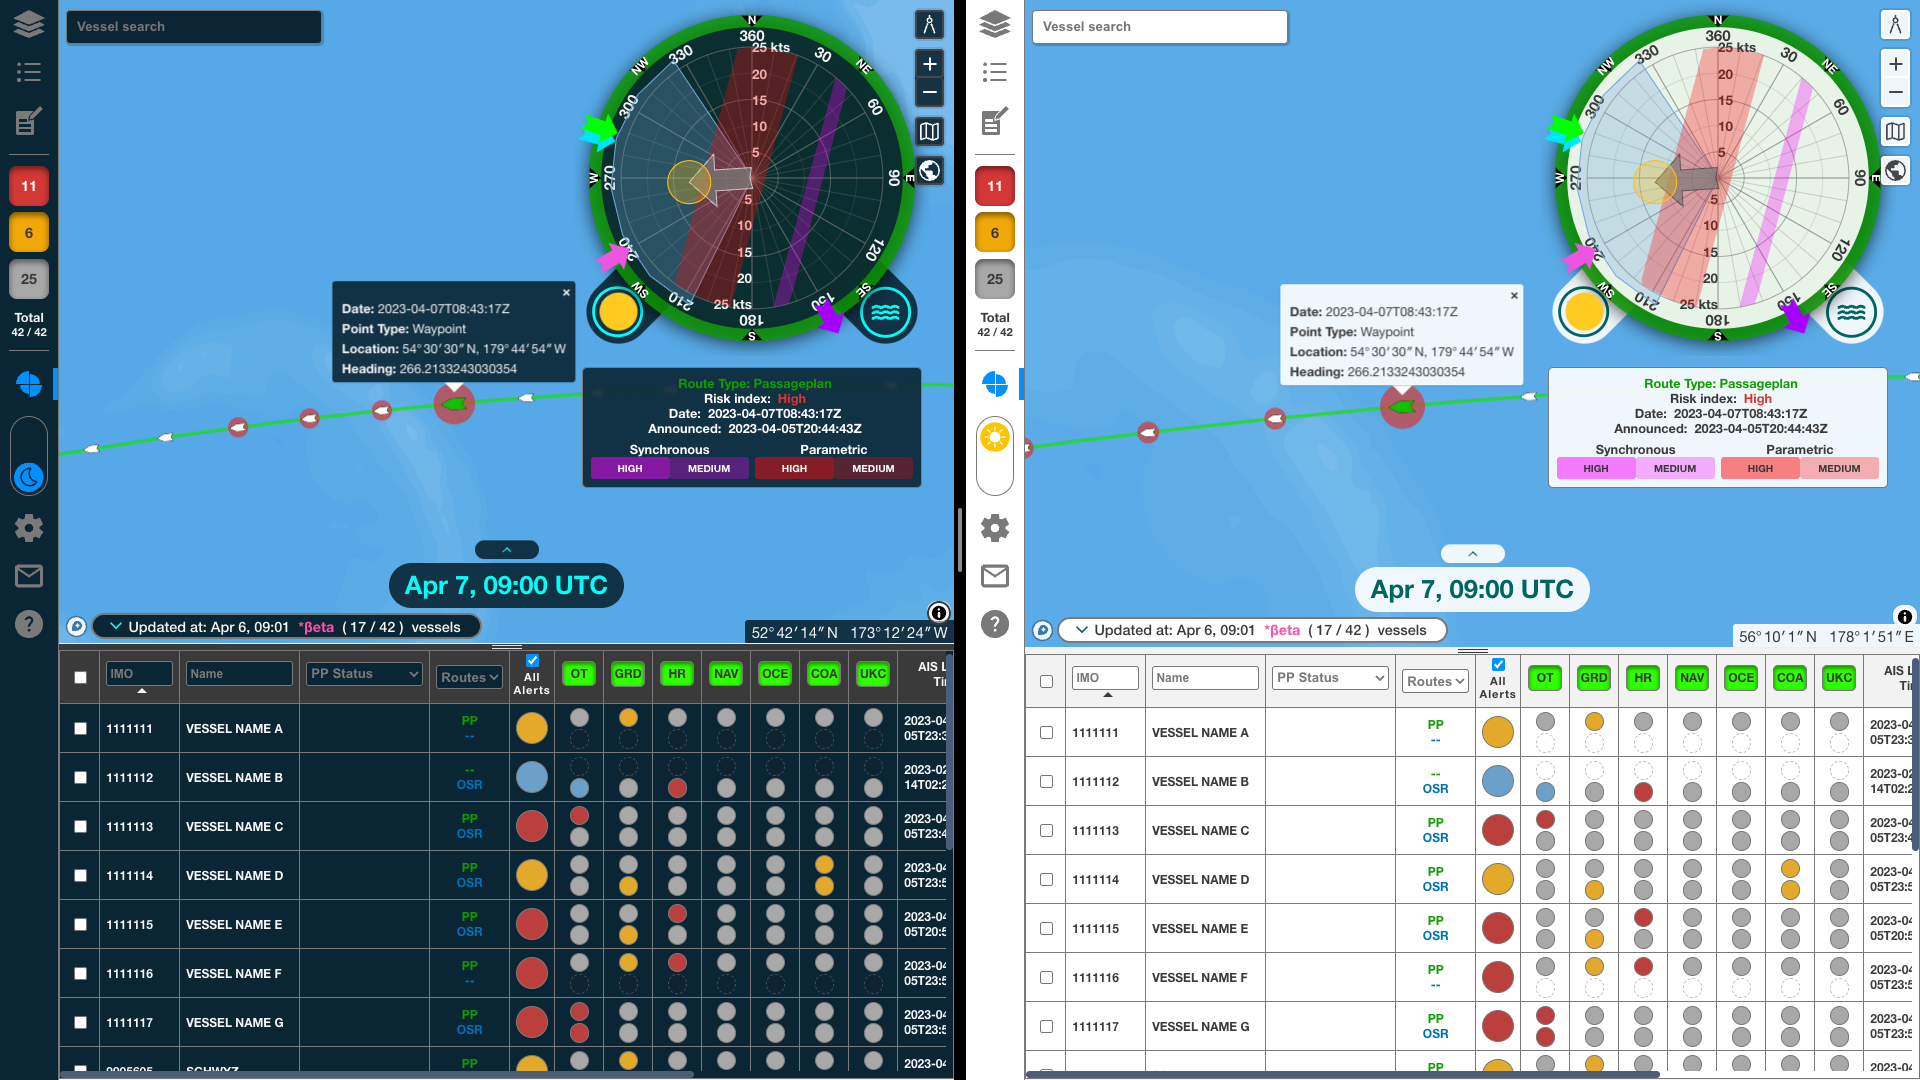
Light / Dark mode
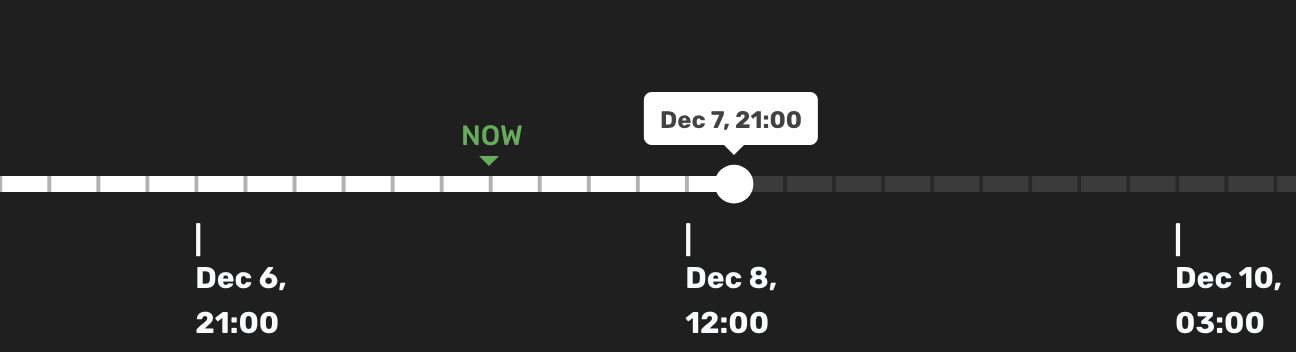
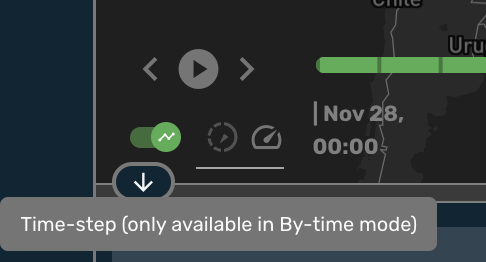
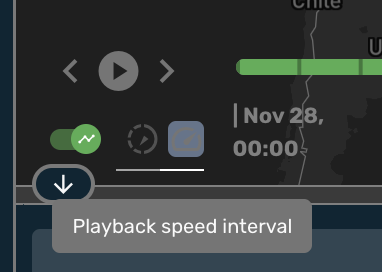
Time controller
Selecting a vessel with route data selects the simulation point nearest the current Time Controller time.
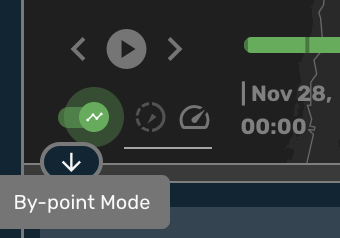
Switch to "by point" mode by checking the "by point" checkbox . In this mode, Time Controller time is set to the selected simulation point time.
Group settings site
Click the cog button to open the Group Settings Site.
Daily Summary Mail
Click the mail icon button to open the daily summary mail.
Guide site
Click the "?" button to open the Guide Site.
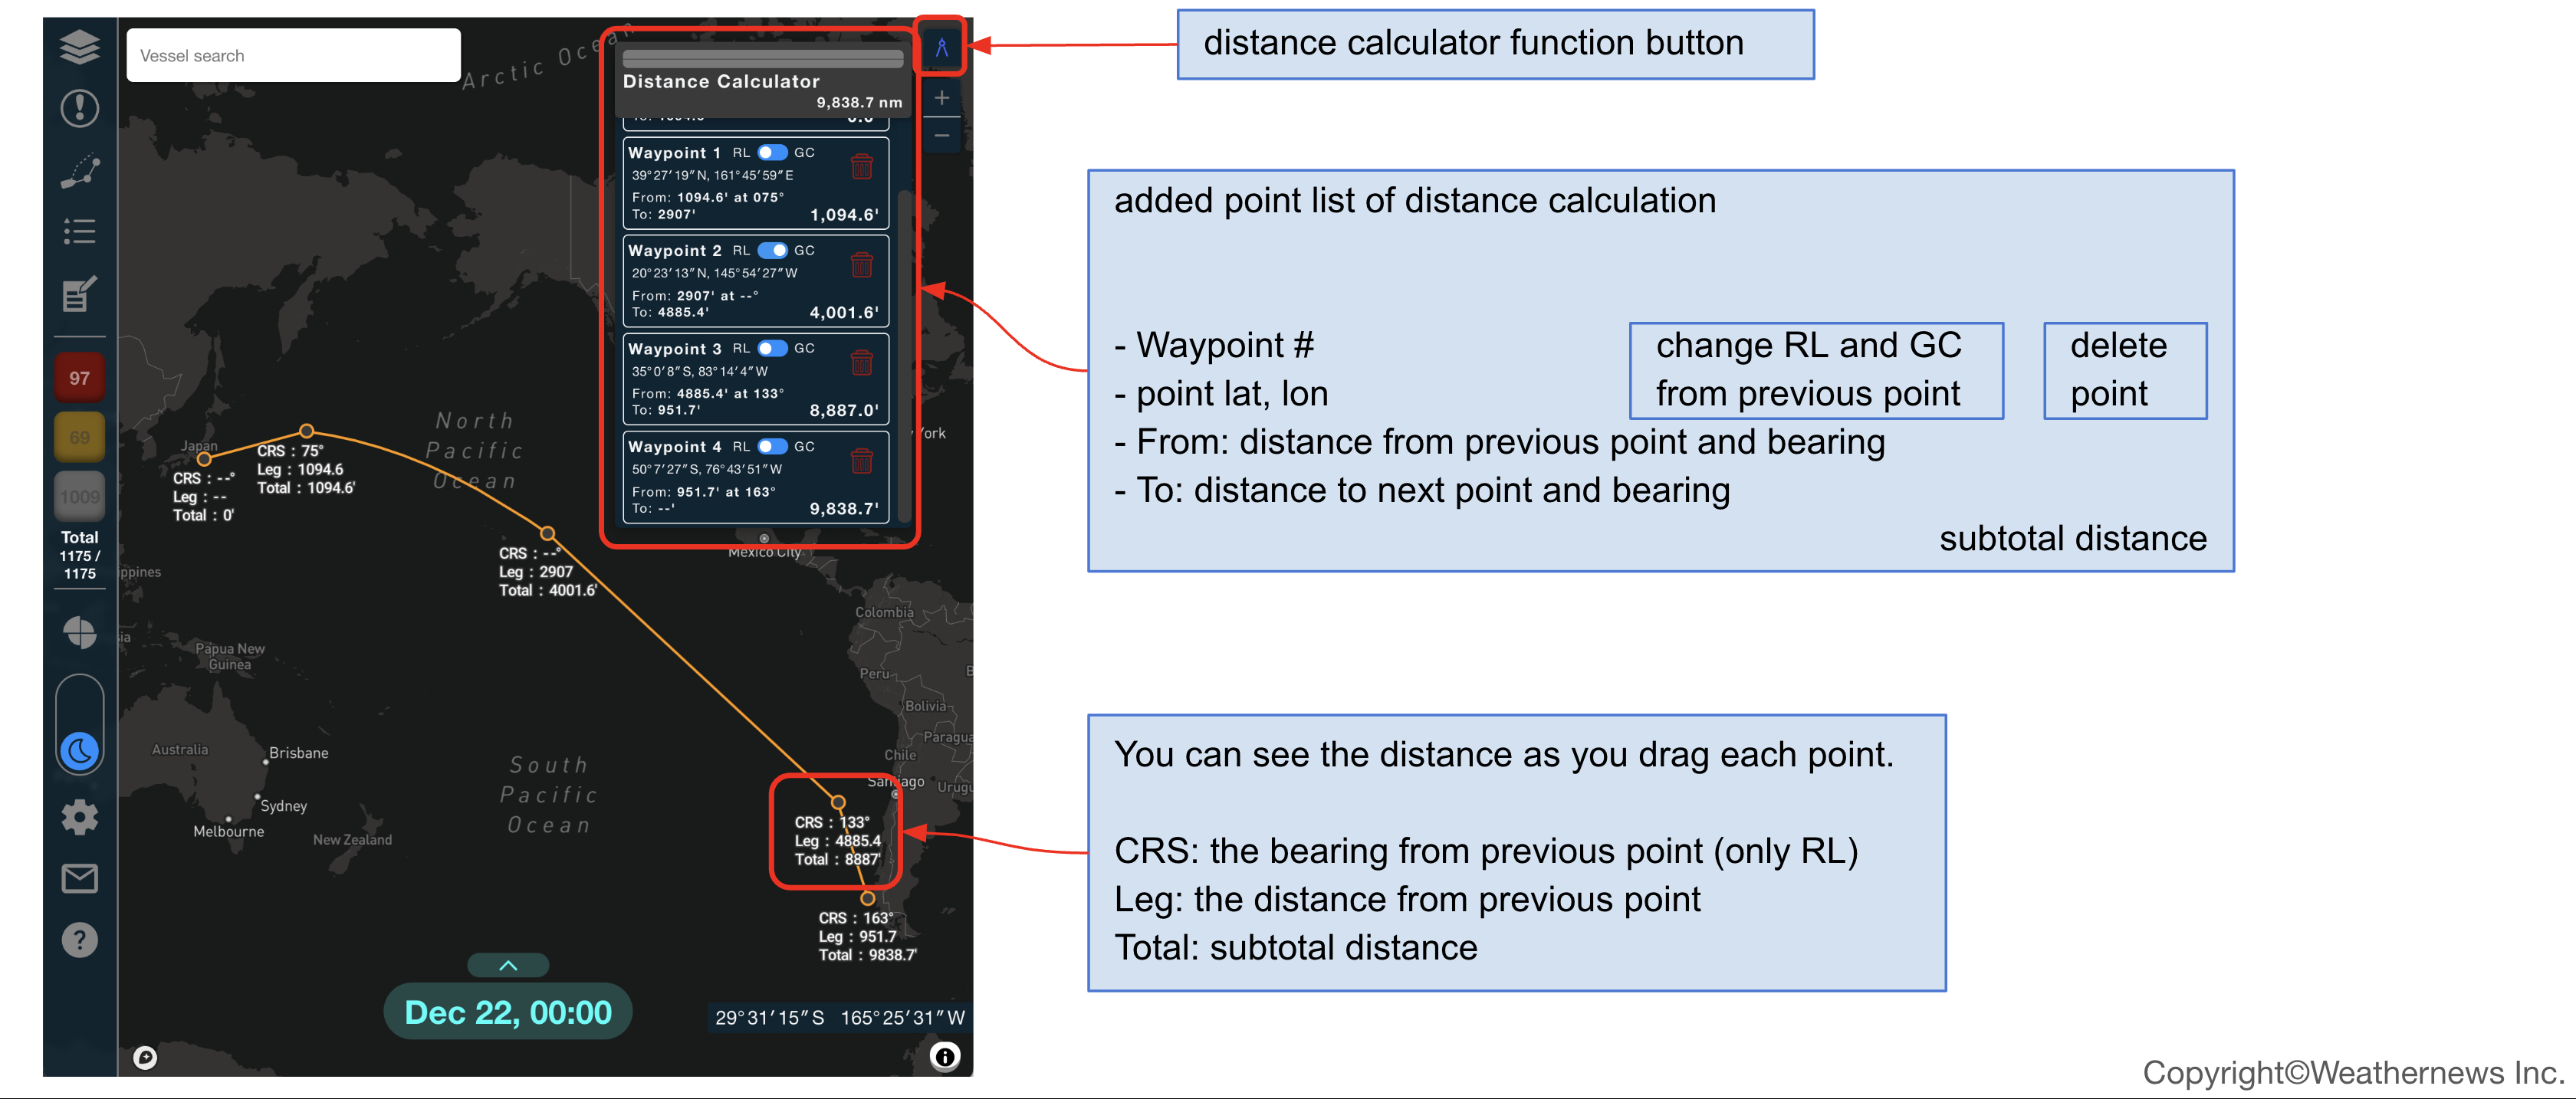
Distance calculator
Click on the map to generate waypoints with leg distance and bearing data.
Basemap selector
Switch basemaps and toggle Nautical Charts (Wärtsilä Voyage WMS Nautical Charts).
Globe projection
Toggle Globe Projection On / Off (Default: Off - Web Mercator).
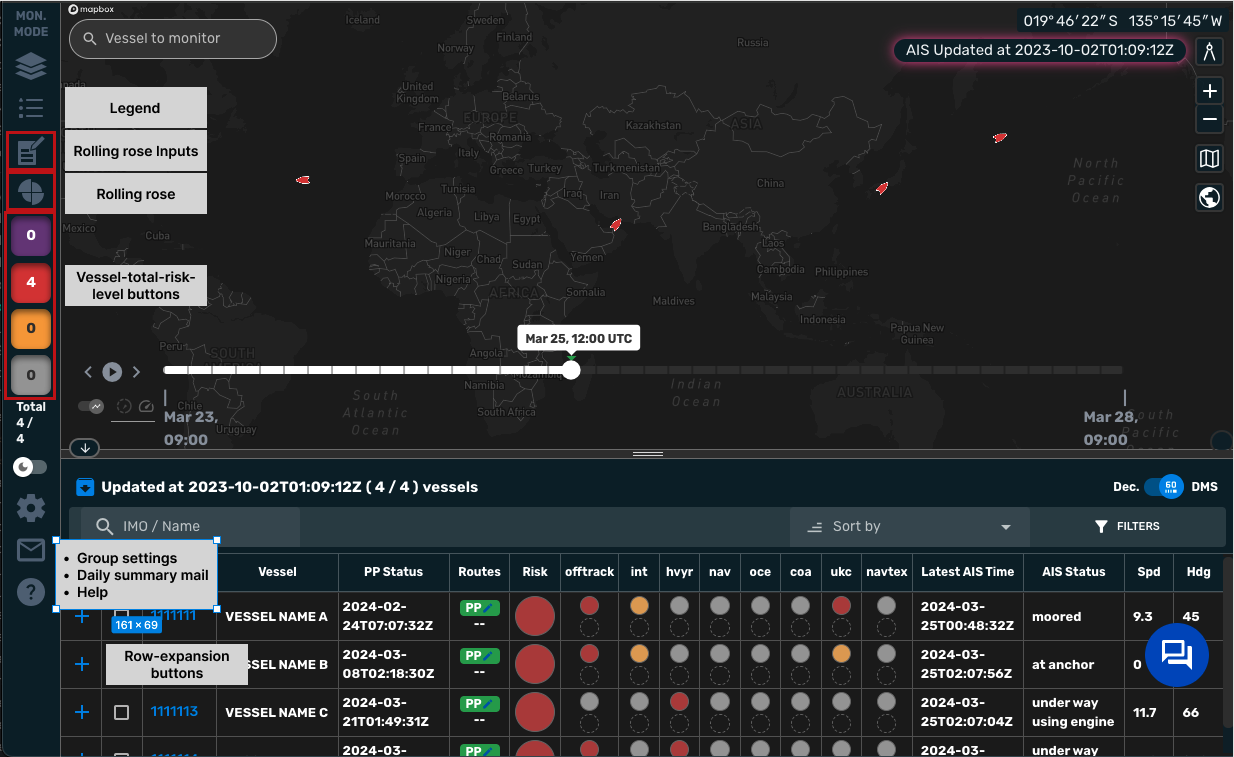
Monitoring list
View vessel alert data
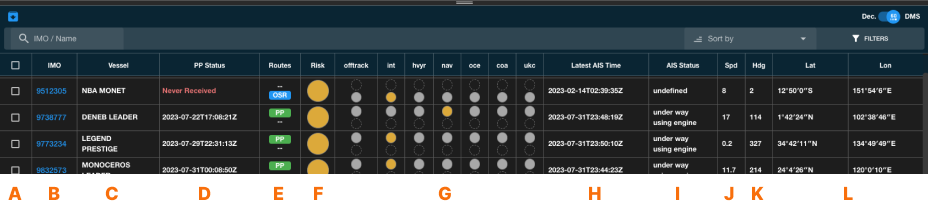
A Vessel label buttons
Toggle individual vessel labels on / off
B IMOs
Search & sort vessels by IMO functionality
C Vessel names
Search & sort vessels by name
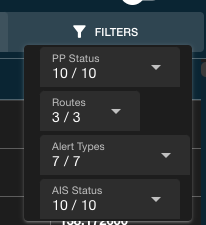
D Passageplan status
Filter & sort by PP status. If the passageplan has been received, the datetime is displayed, otherwise the reason for its absence is displayed
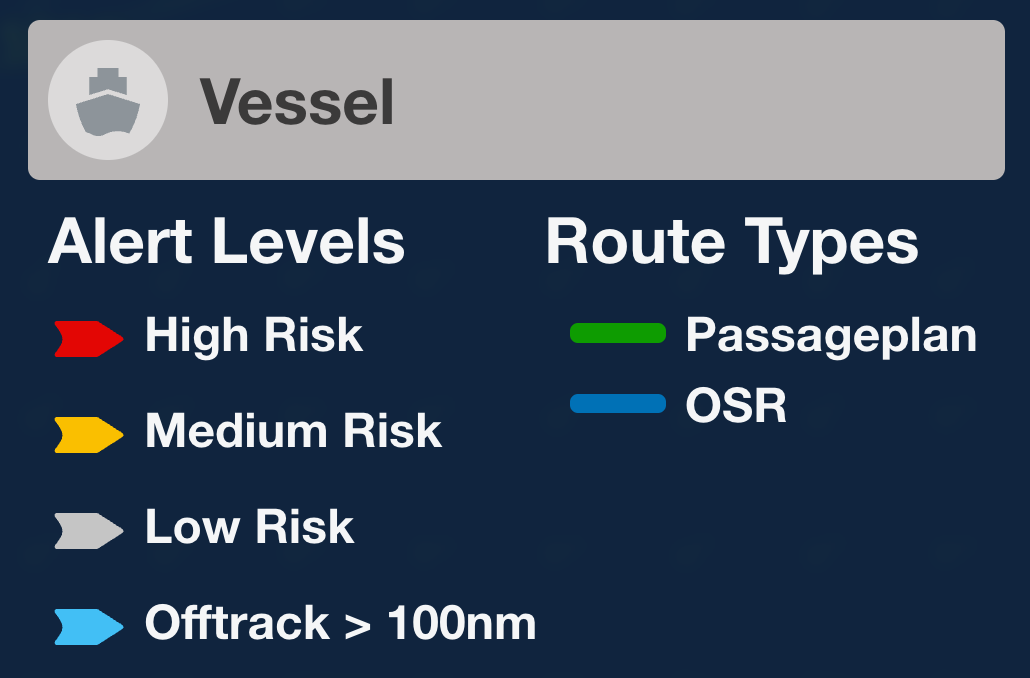
E Route types
Select which route types are displayed on the map. The vessel counts are updated accordingly.
| Route types | Description |
|---|---|
| AIS-Only | Vessels with no relevant route data. Only position data is displayed |
| Passageplan | Vessels with a Passageplan received by WNI *Contains risk assessment |
| OSR | Vessels under OSR service, or with OSR routes created with OSR *Contains risk assessment |
Learn about Route types in depth here
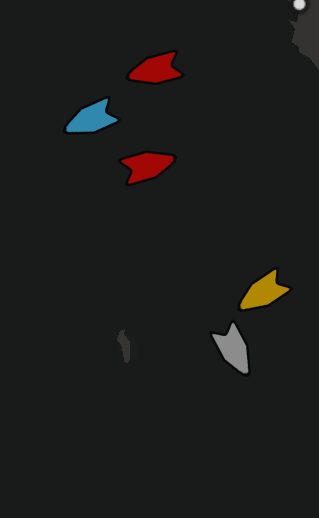
F Highest risk levels
View the highest risk level based on the selected alert types (Matches the map vessel colors). Click to select the vessel and display it's routes and alerts.
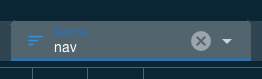
G Alert type risk levels
View, toggle, and sort based on individual alert types. (Sort) The vessel risk level counts are updated accordingly.
Learn about Alert types in depth here
H AIS latest time
View and sort by latest AIS timestamp
I AIS status
View and sort by AIS status
J Speed
View and sort by speed
K H (Heading)
View and sort by heading
L Lat & Lon
View Latitude and Longitude and toggle between DMS (Degrees, Minutes, Seconds) and Decimal displays
M Expand-row button
Expand the second row with additional info only visible when the screen is too small to fit all items
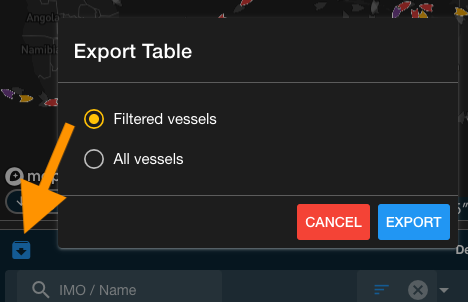
N Export button
Download table data - either all vessels, or only the vessels currently in the table (sorted).
Risk Communication Function
Create and manage multiple usernames, make comments (including editing, replying, and creating new comments), and read other users' comments made on a vessel.
There are 4 tabs in the side panel.
Heavy Rolling
Now Rolling rose is positioned in the side-panel.
Damage Risk Graphs
This tab displays graphs of damage risks for Passageplan and OSR routes, as well as a comparison between the max values of PassagePlan and OSR risks.
Comments
This tab is visible only when a vessel is selected. Users can manage usernames here, make comments (including editing, replying, and creating new comments), and read other users comments made on a vessel. Now users can tag other users by using '@' when creating new comments or replies.
a. Open Side panel by clicking on the side-panel button or click on any vessel.

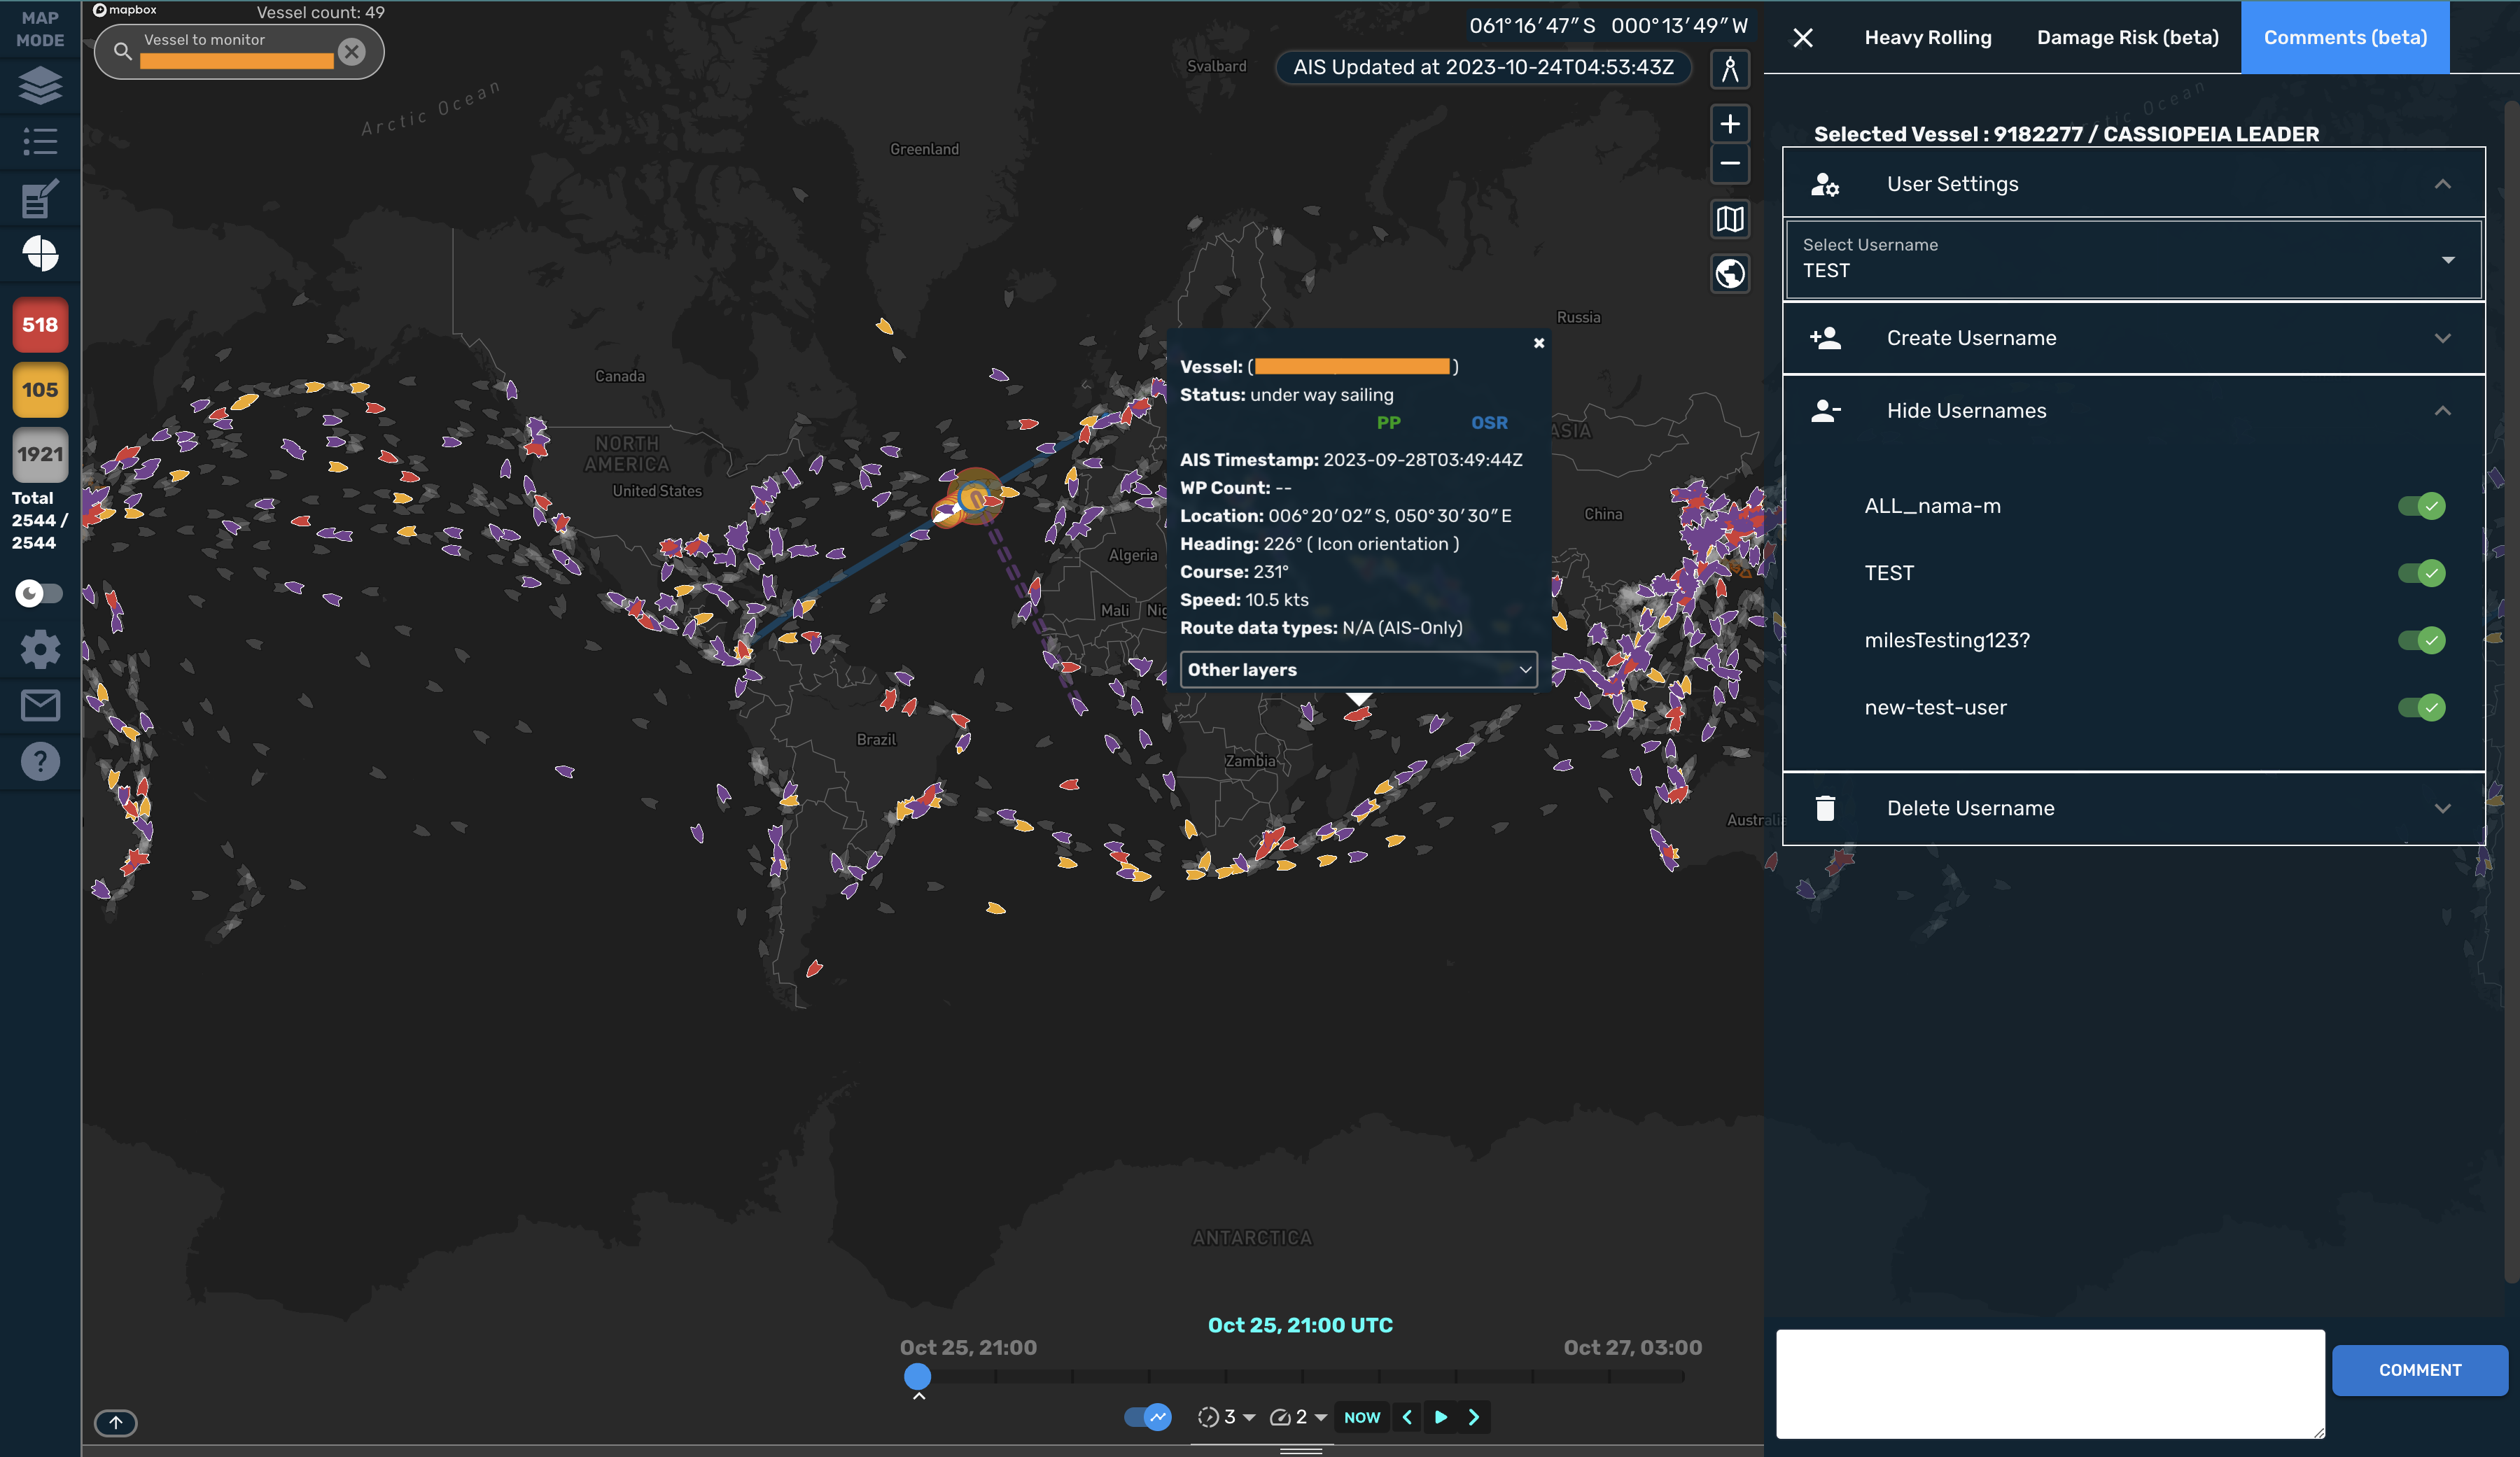
b. Create an Username by clicking on "Create Username" and then input your desired username.
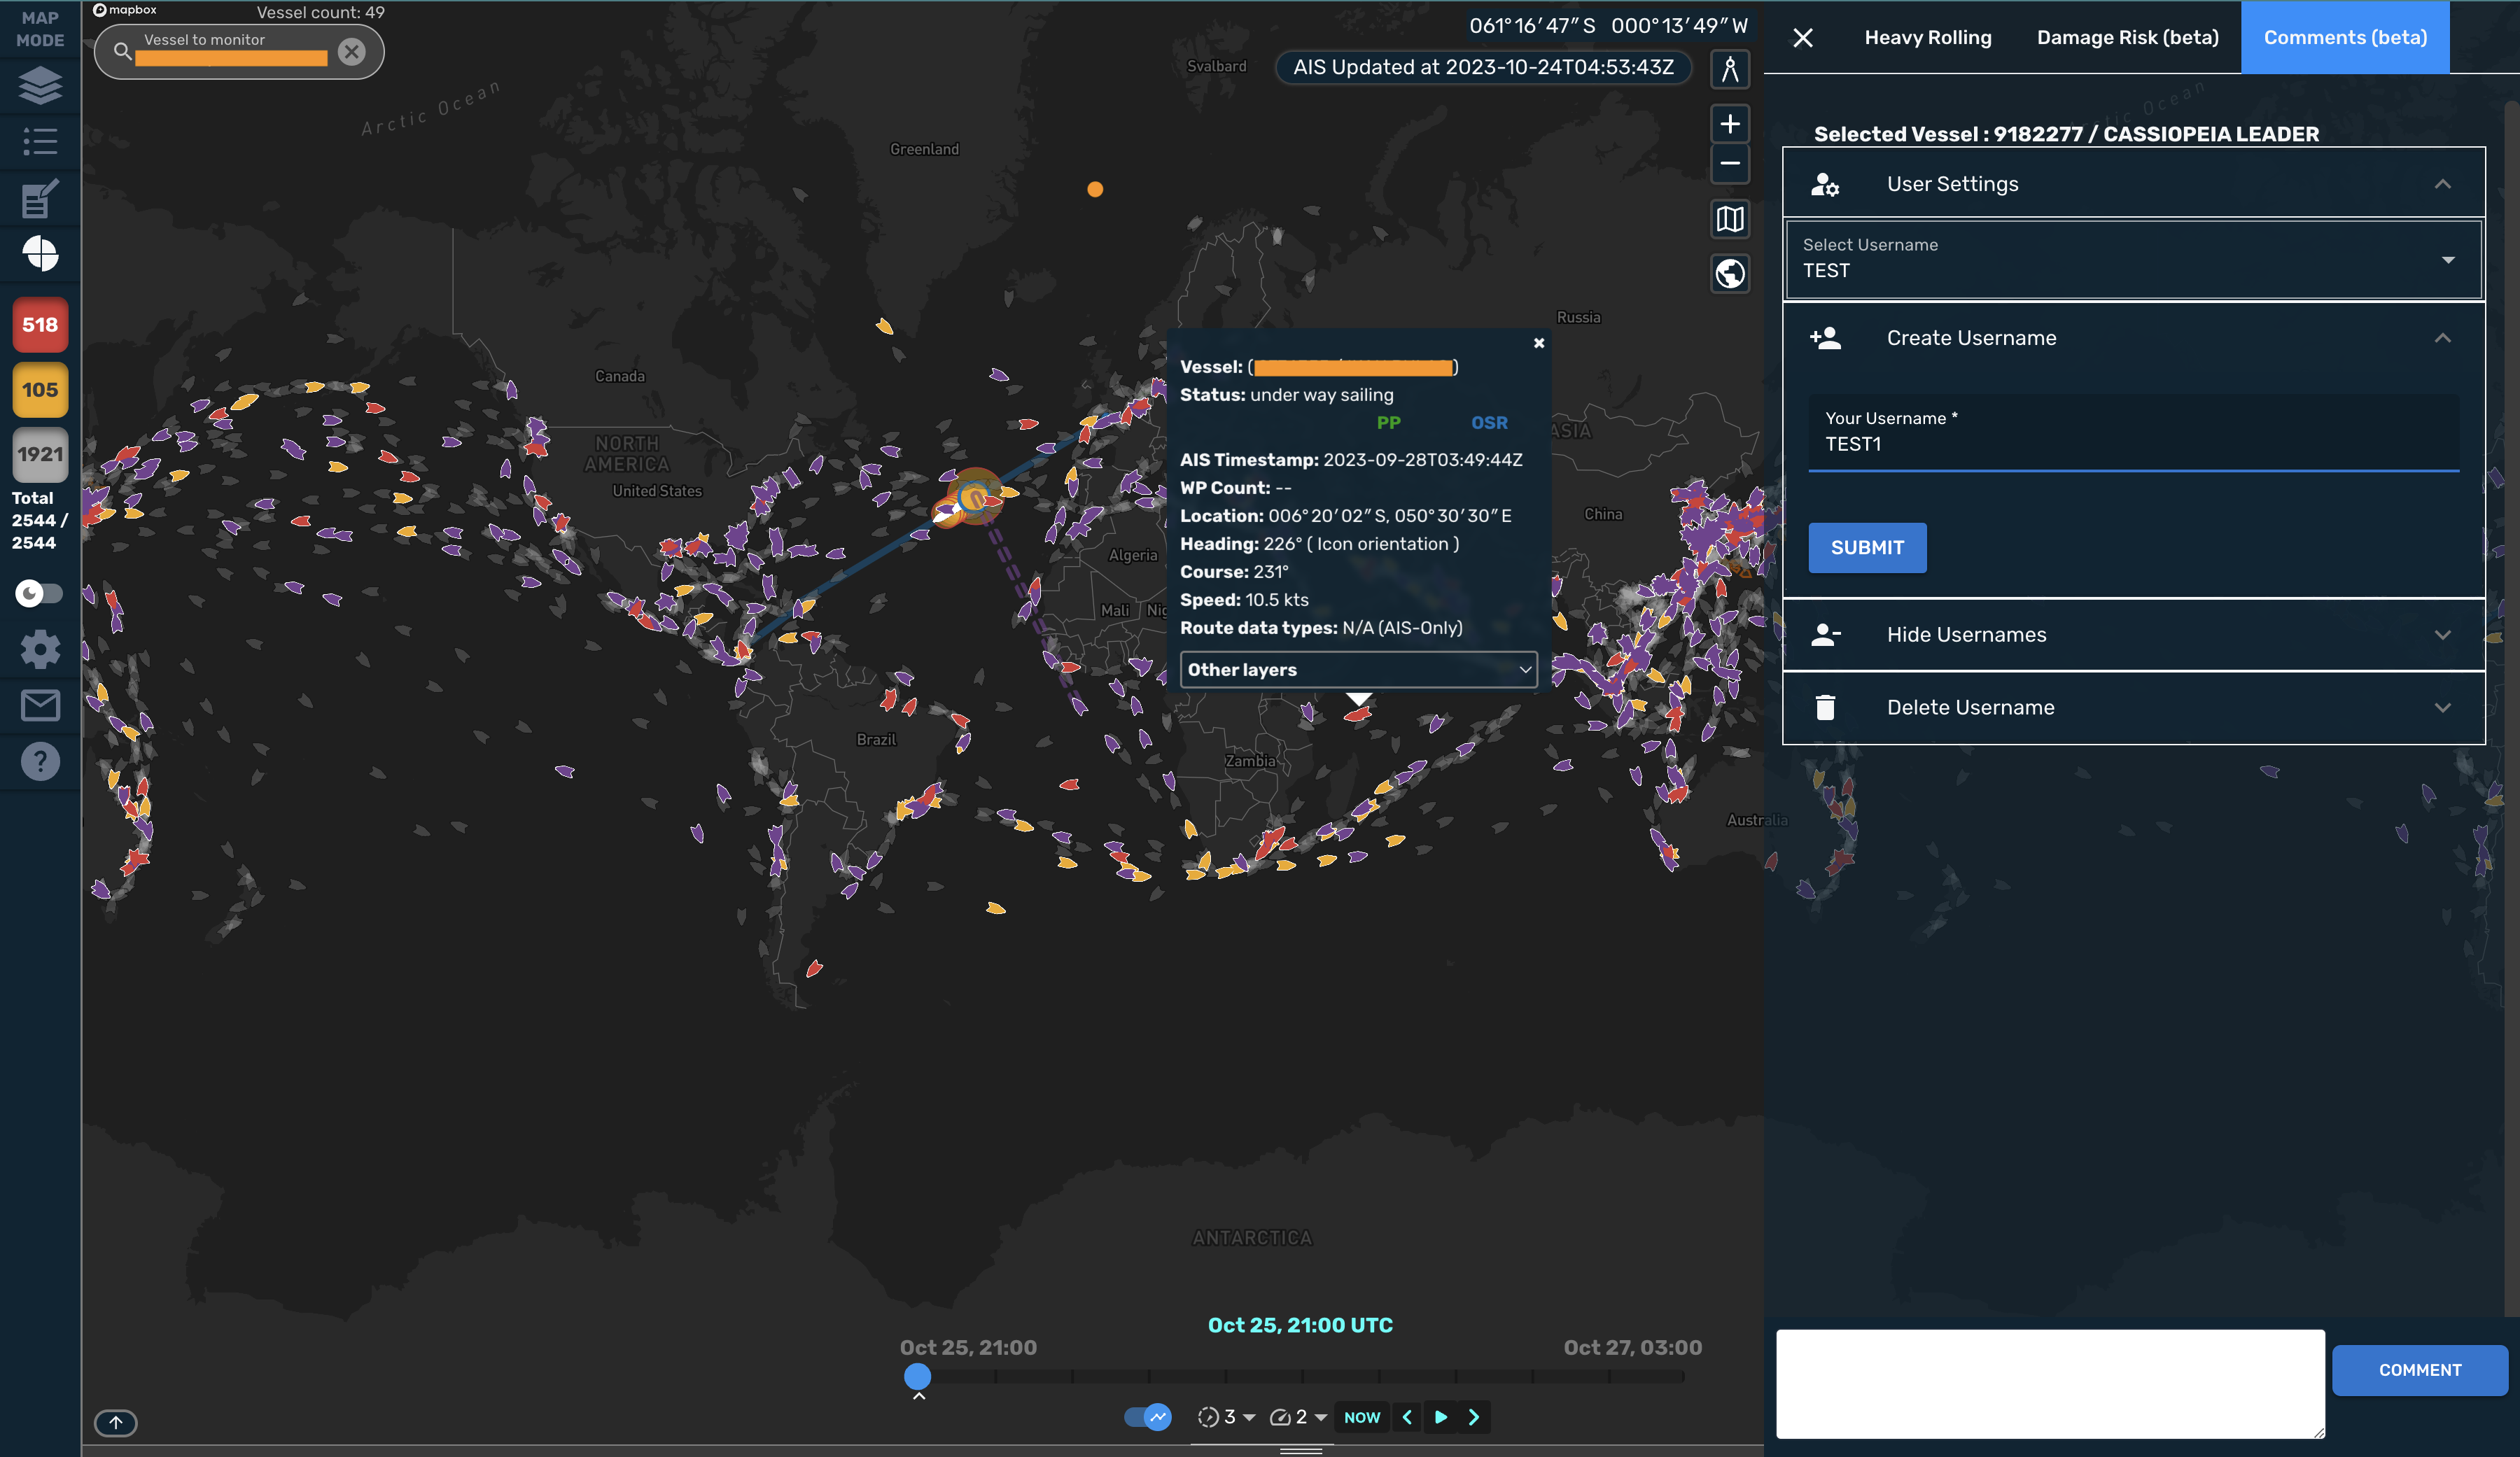
c. Select an Username by clicking on "Select Username".
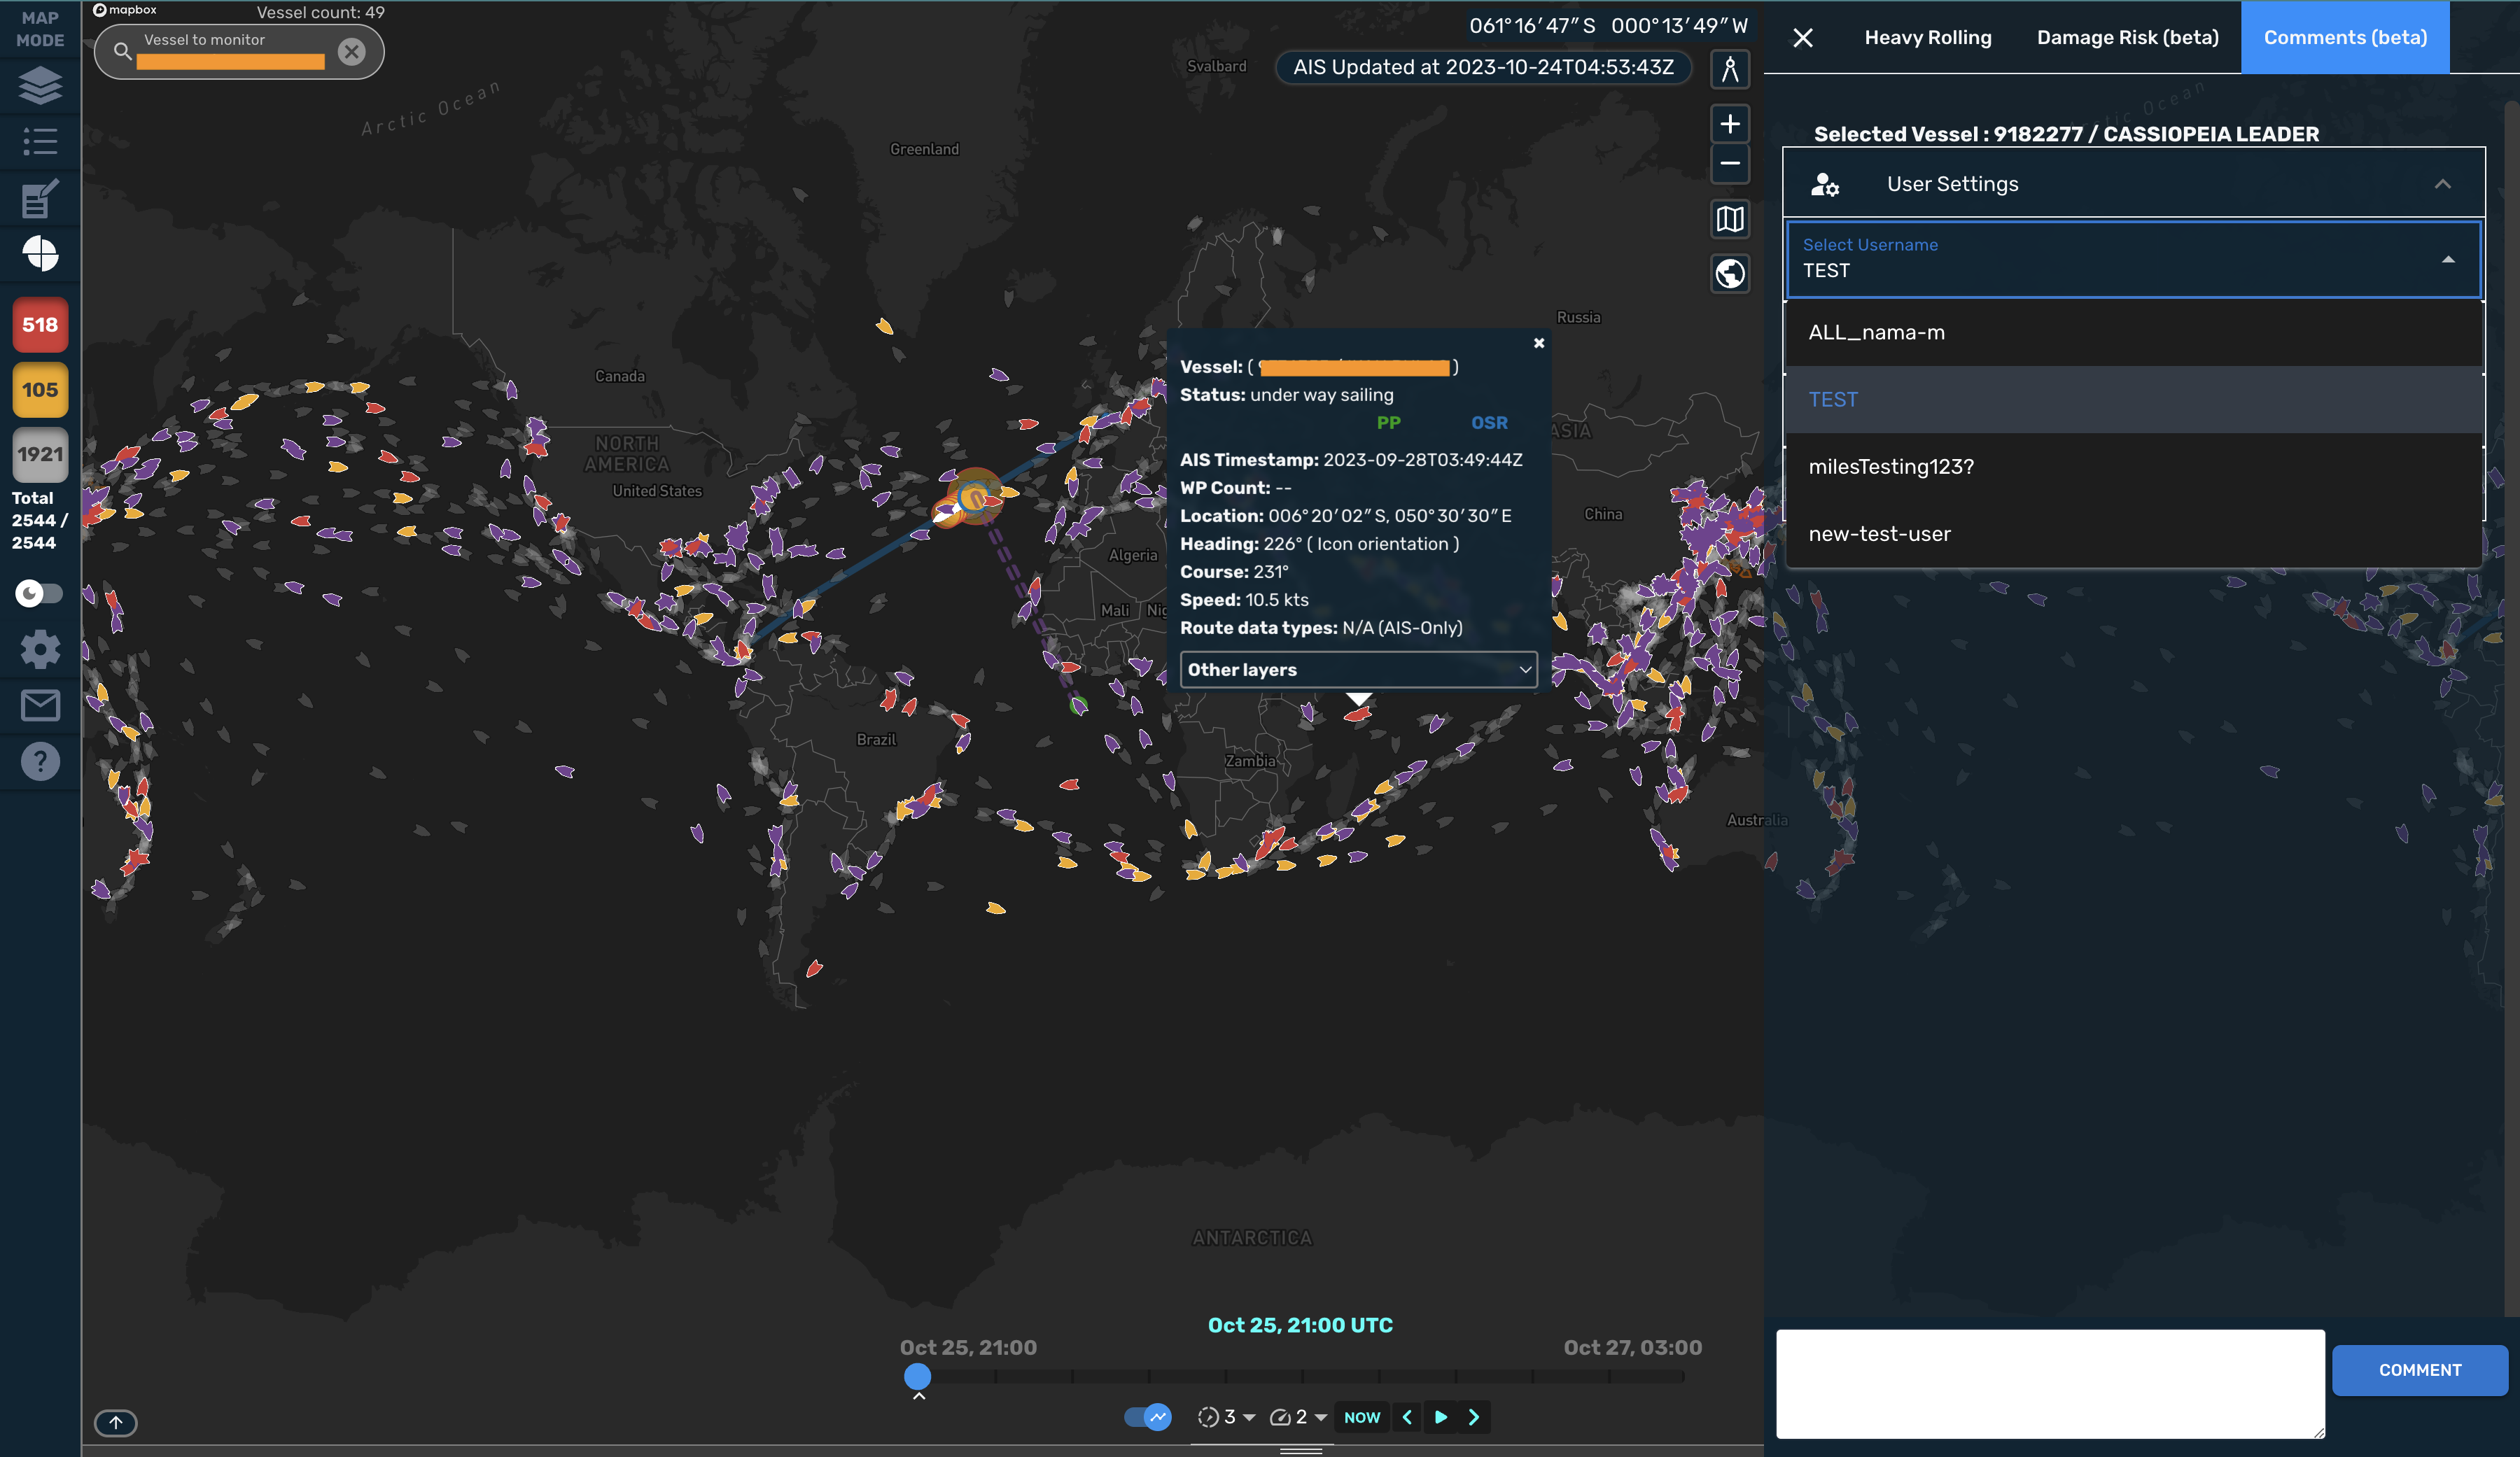
d. Hide an Username by clicking on "Hide Usernames". After this you can choose usernames that you don't want to be shown on the select usernames list.
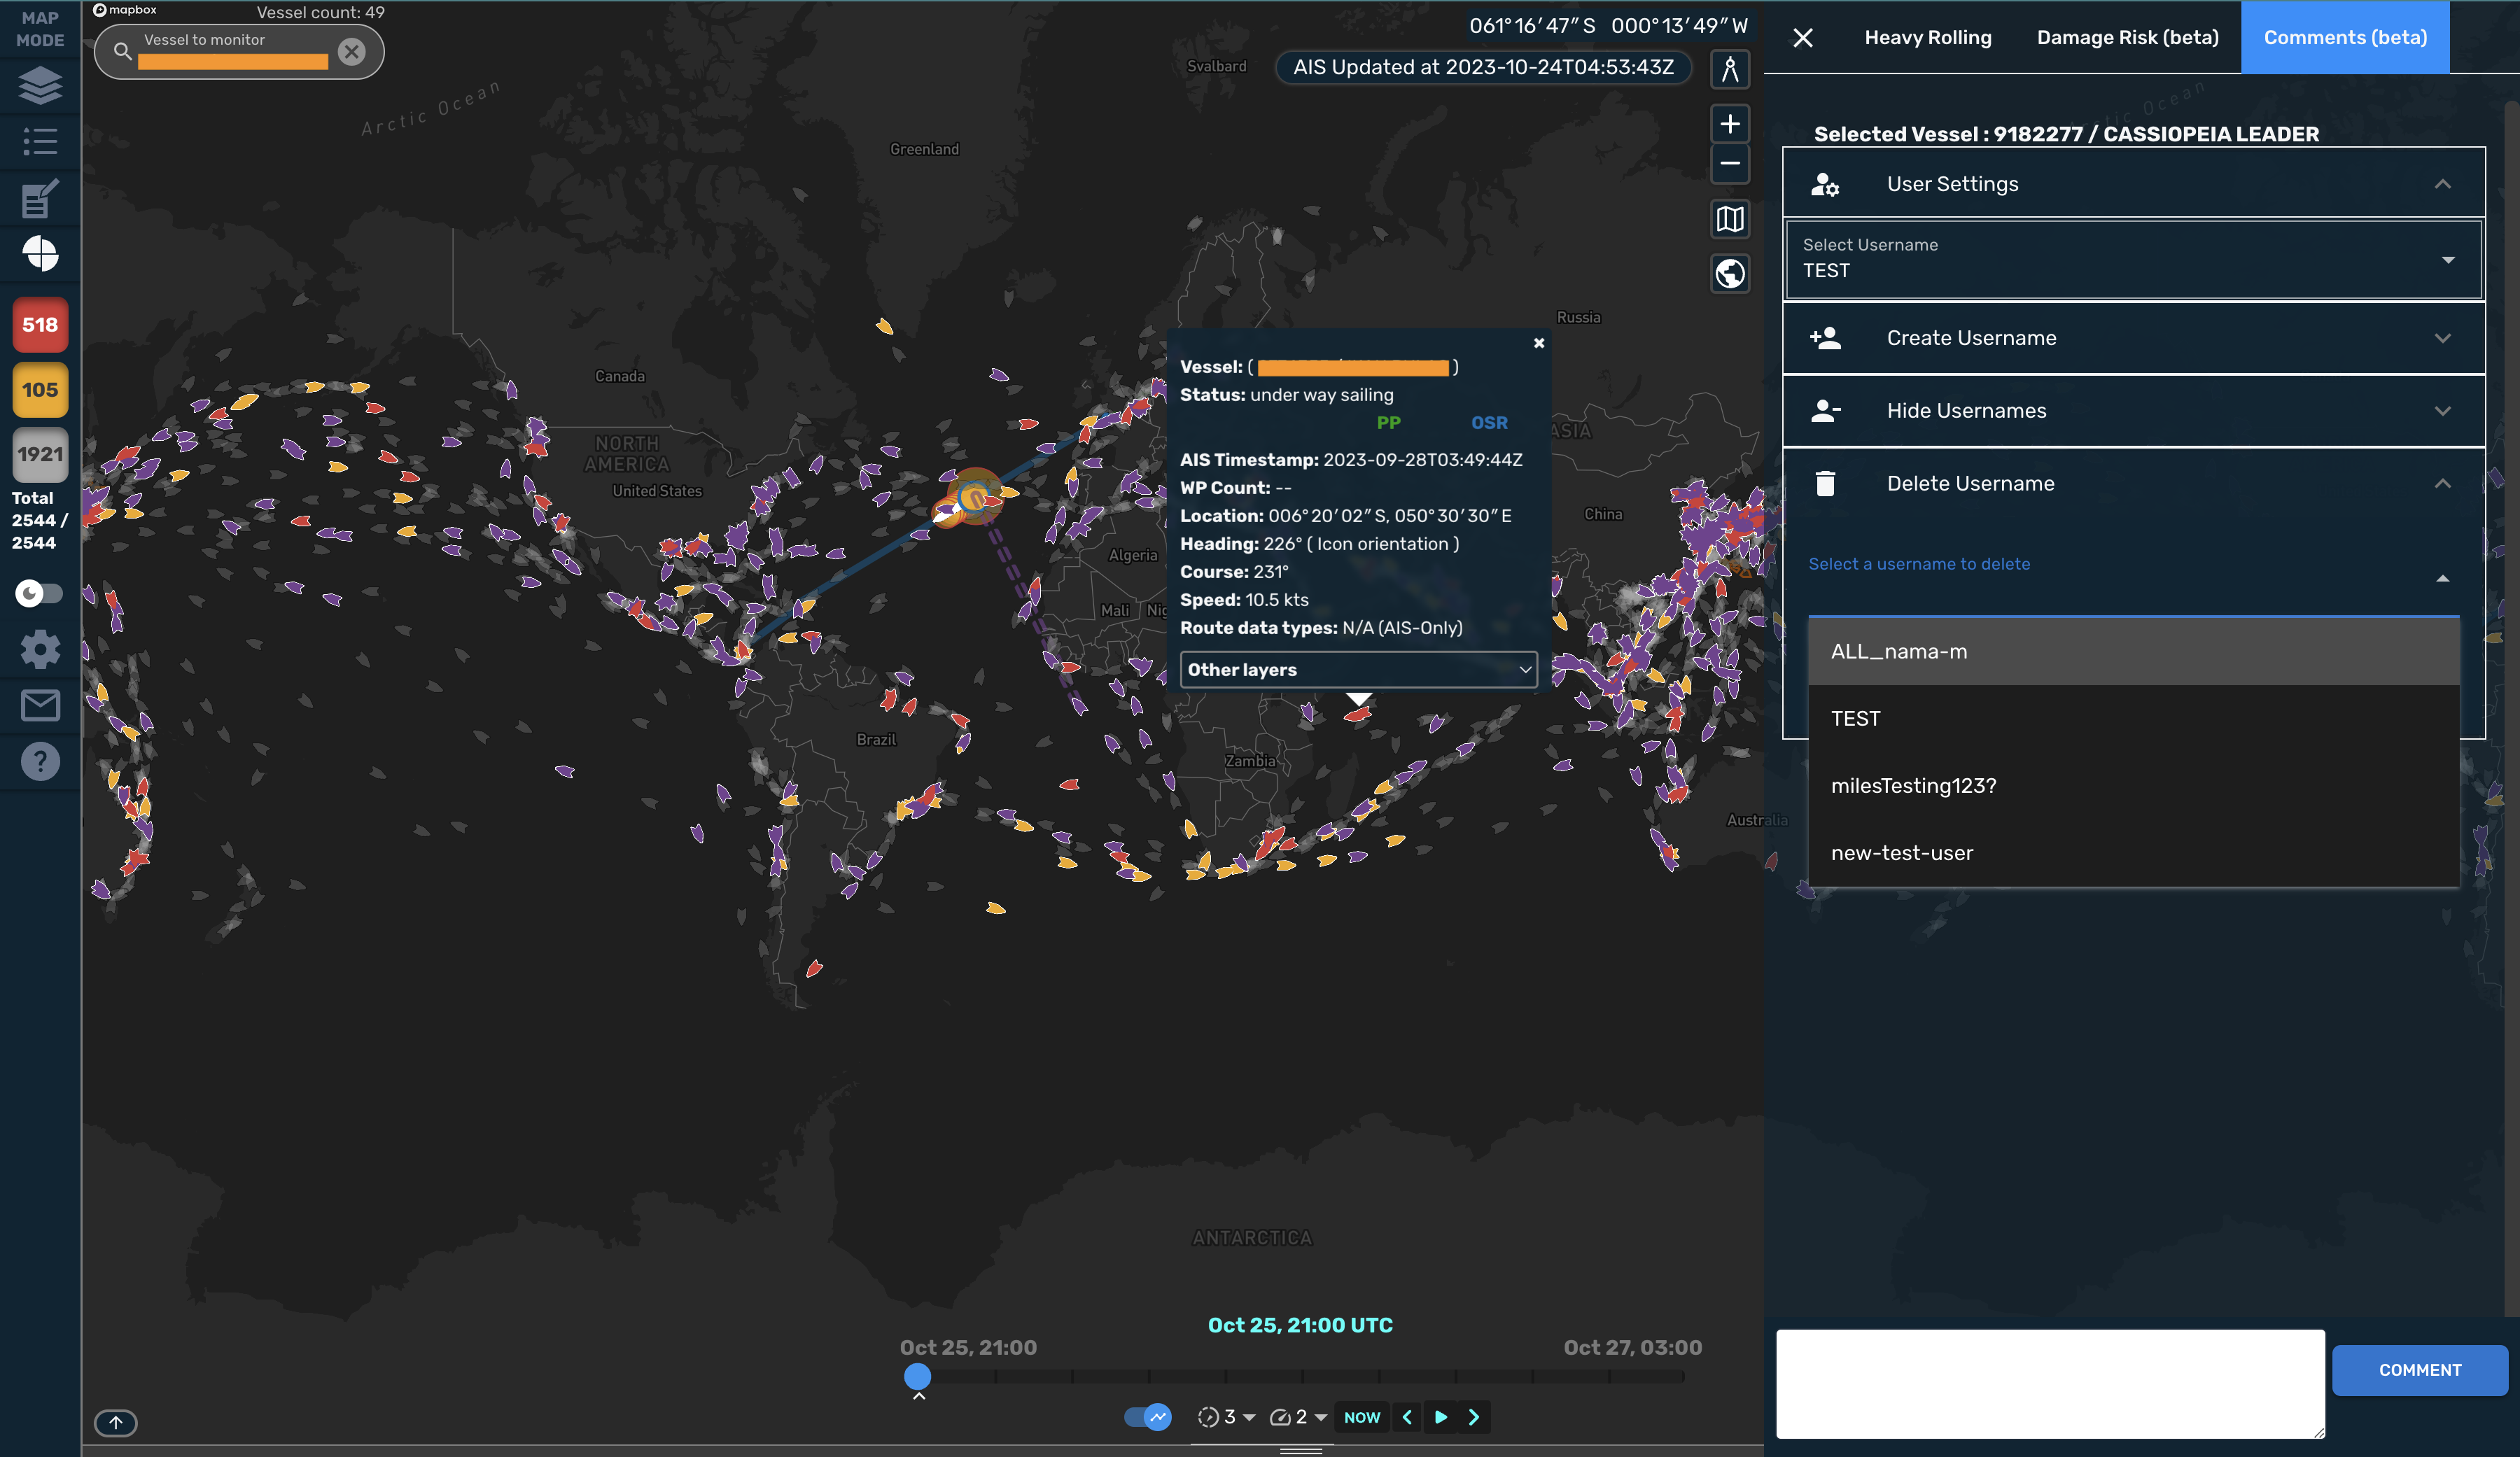
e. Delete an Username by clicking on "Delete Username". After this you can select a username that you want to delete.
f. To create a new comment type in the textbox at the bottom of the screen. To submit the comment either press enter or click on "COMMENT" button.
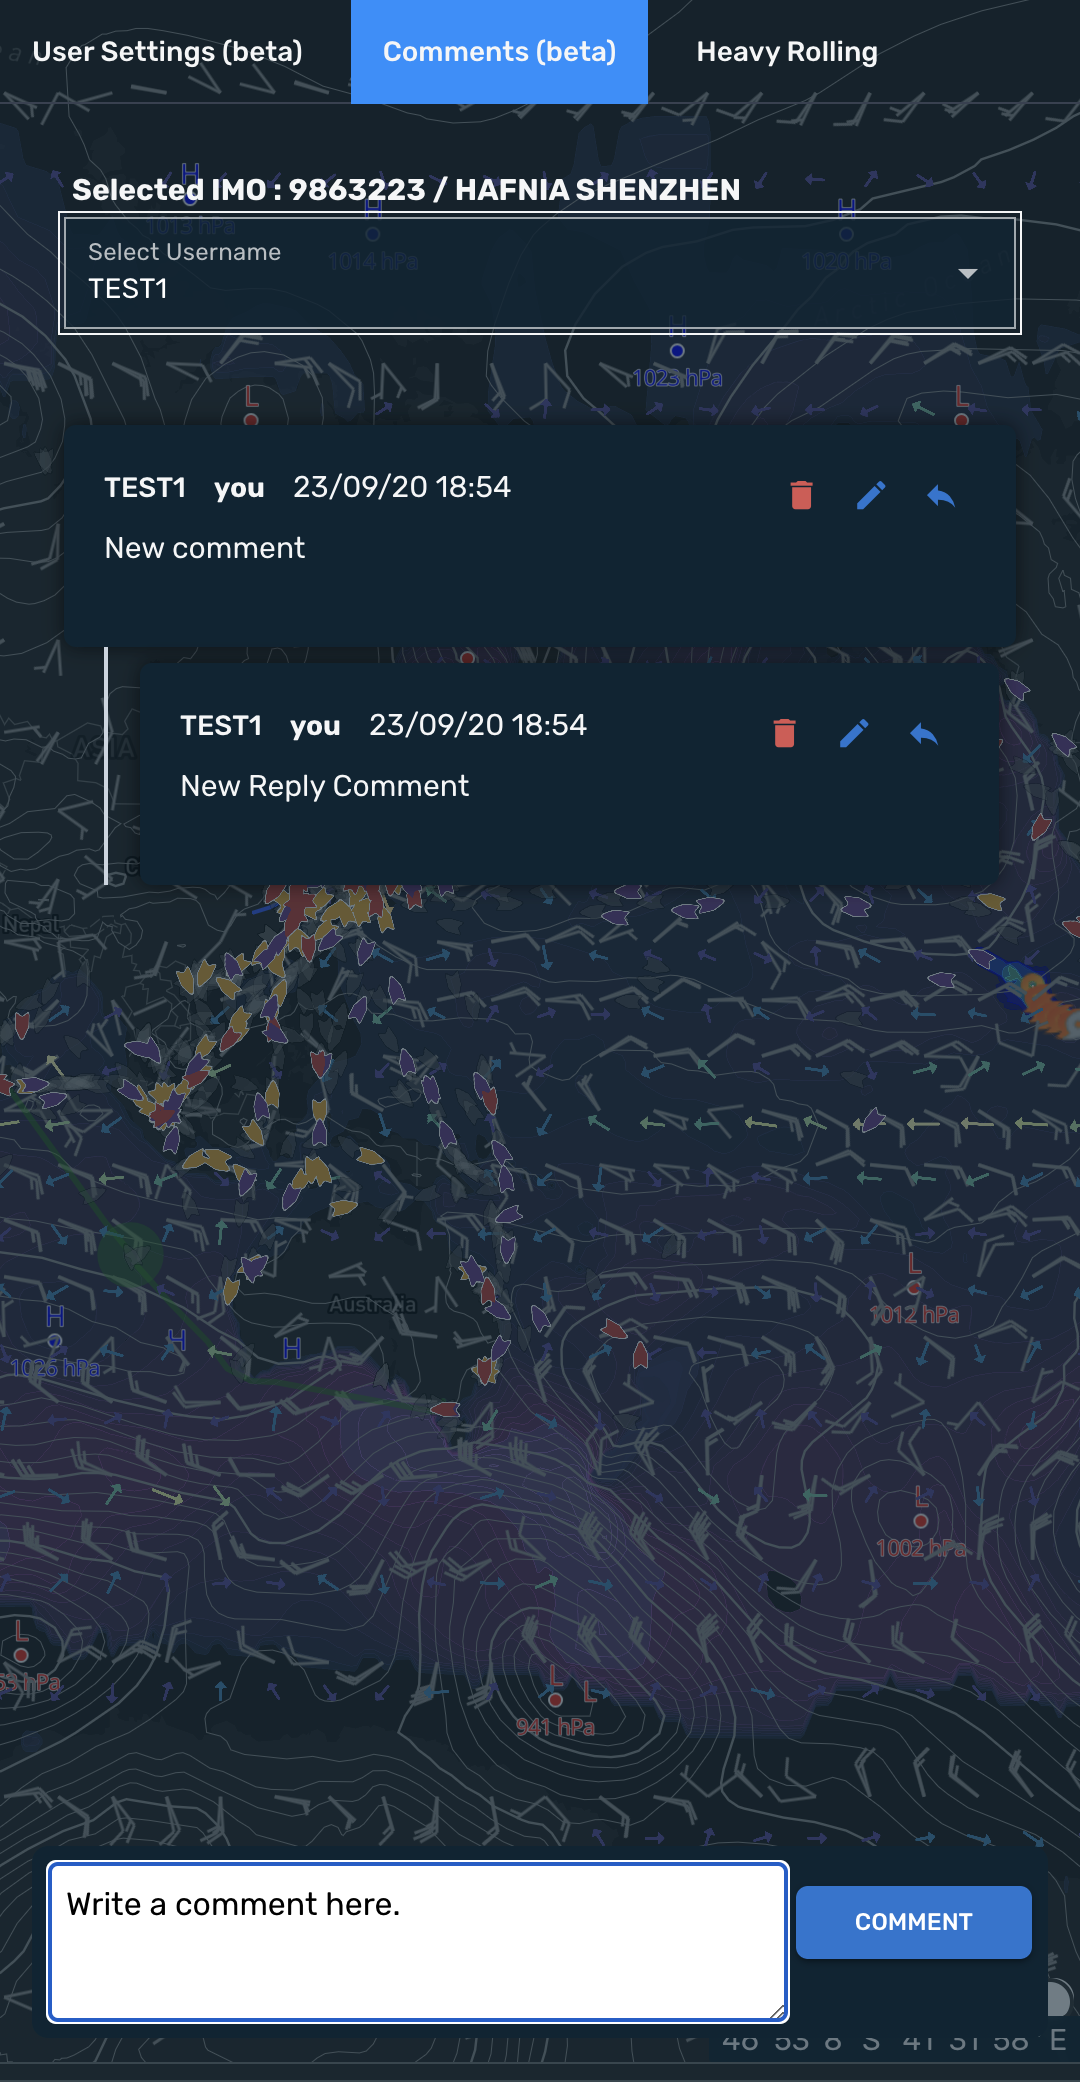
g. delete, edit or reply buttons are available for the comments created by you. For other user comments only reply button is available.
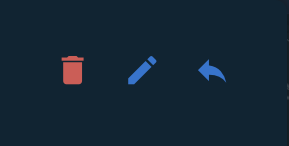
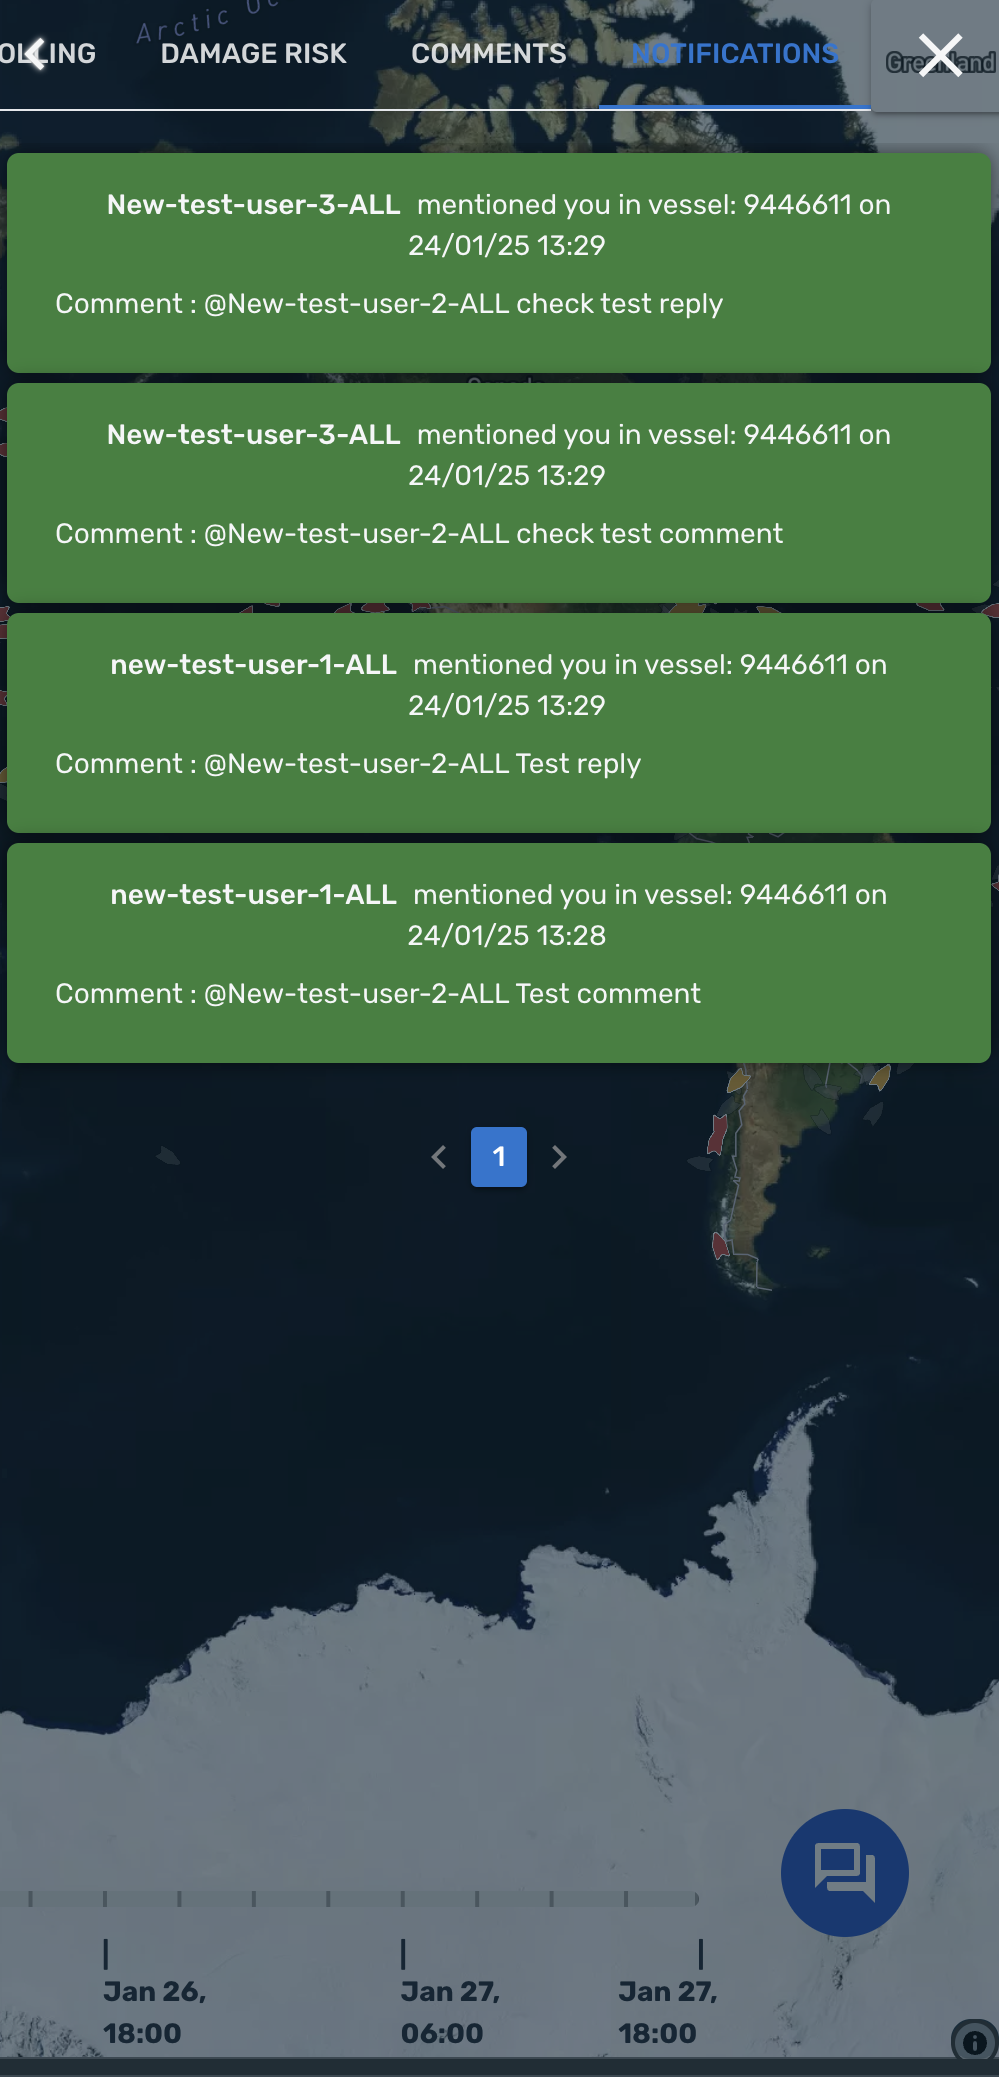
Notifications
Users can check notifications when they are tagged in comments.
Map Mode
Select the map mode from the map mode selector.
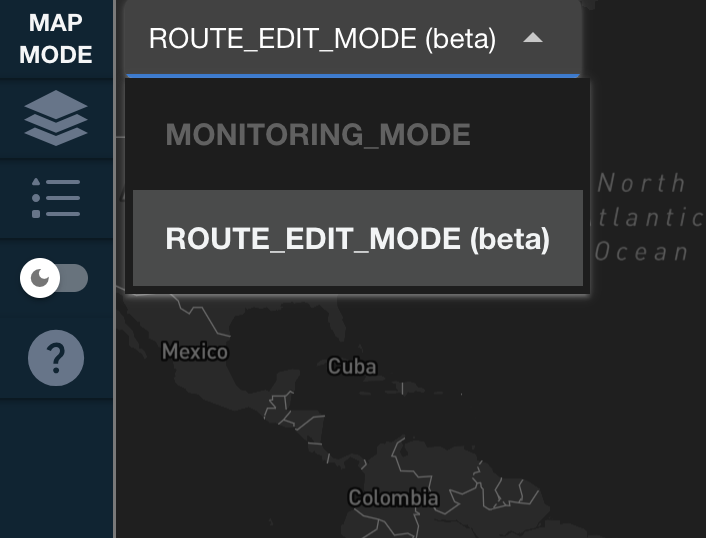
Monitoring Mode
Monitor vessel alerts via the monitoring list.
Route Edit Mode
Note
This feature is still in beta. However, the route will now be updated. We welcome your feedback.
Note
When updating a table value, please click the "enter" key to save the value. This may change in the future.
Edit existing routes - creating up to five different edits - then select the best option to update the route and re-run the alert simulation.
Vessel Route Search
View vessels with editable routes. Select one to begin editing.

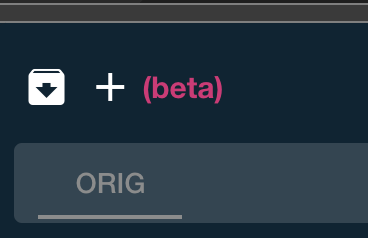
Add Session Button
Click the Add Session button (+) to the right of the download button to add a new route based off of the original route. (Up to five edits at a time)
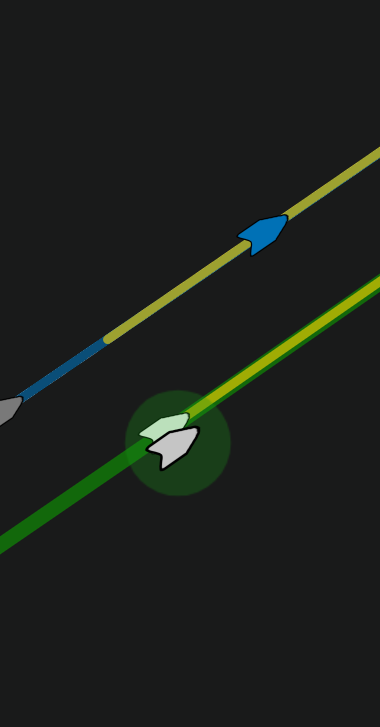
Current Route Indicator
The current route is indicated by a gold ribbon icon. Once a route is selected, the ribbon shift to the selected route.

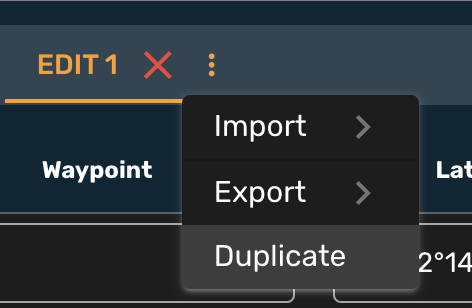
RTZ Import and Export
Import and export RTZ files to and from the route edit mode.
Import

Export
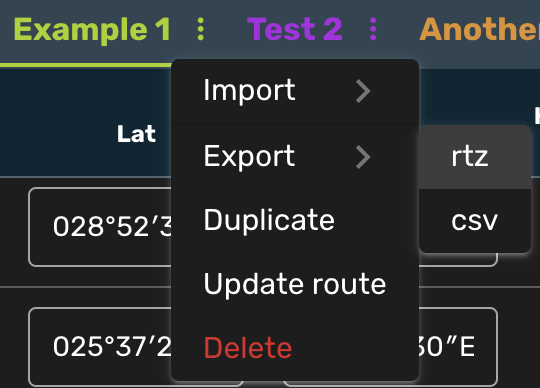
Edit Duplication
Duplicate an edit by clicking the duplicate button to the right of the edit name and clicking "Duplicate"
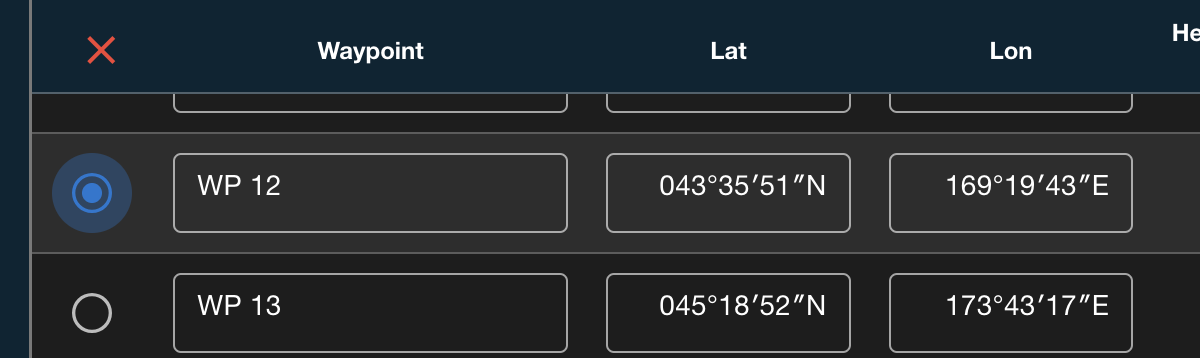
Waypoint Table
View, edit, and delete waypoints in the waypoint table at the bottom of the screen. On mobile, click the blue (+) to expand the row.The selected or hovered waypoint will be highlighted on the map. Click a waypoint on the map to select it in the table.
To delete a waypoint, select the waypoint with the radio button on the left, then click the red (x) above the radio buttons.
Edit Route Name
Click the edit name to update it. Hit "enter" to save the change.

Route Comparison Table
Compare edits based on distance, WP count, or ETA. Click the column header to sort by that column.
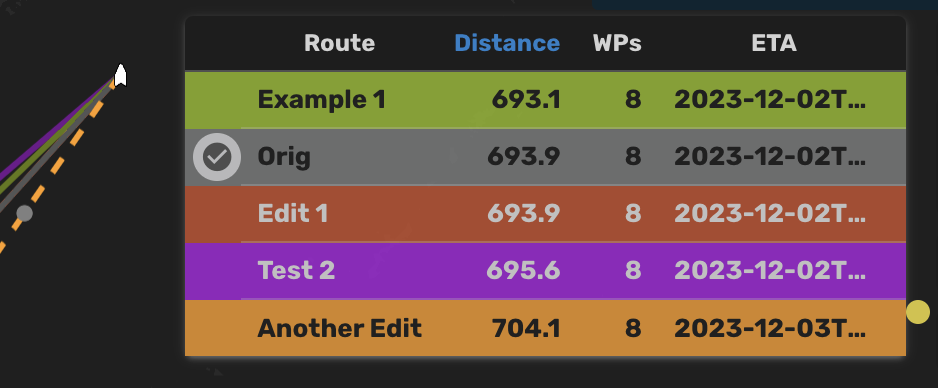
Select Edit Button
Click the button to the left of the route in the Route Comparison Table to update the route with the selected edit. *Beta: The route will not be updated in the beta
- Click the Select Edit Button
- Select a user to save as
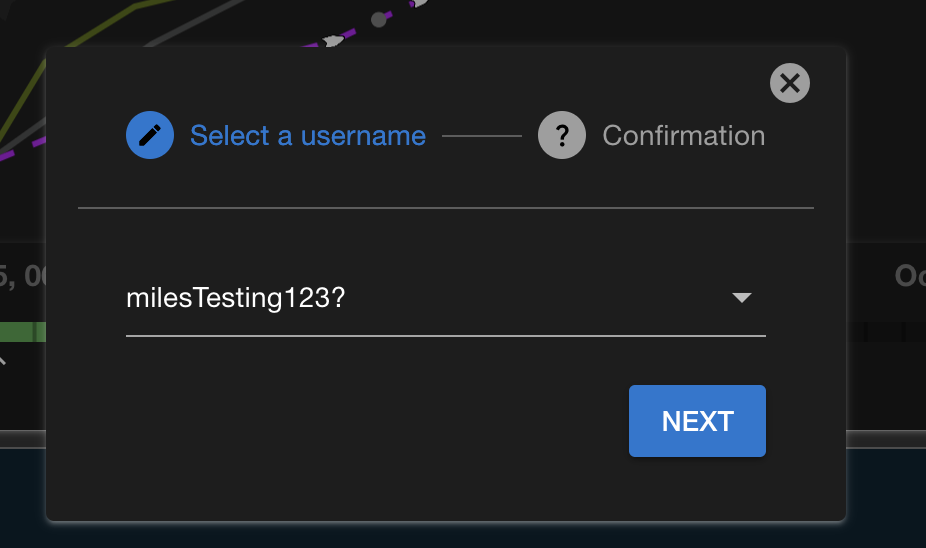
-
Confirm
Vessel and Alert details
Hover over a vessel or alert to view detailed information.
| Item | Description | Sample |
|---|---|---|
| AIS | ( IMO / VESSEL NAME ) Alerts Passageplan filename Message Date AIS Timestamp Location (Latest AIS position) Heading Course Speed Route Data Types (Available route data) |
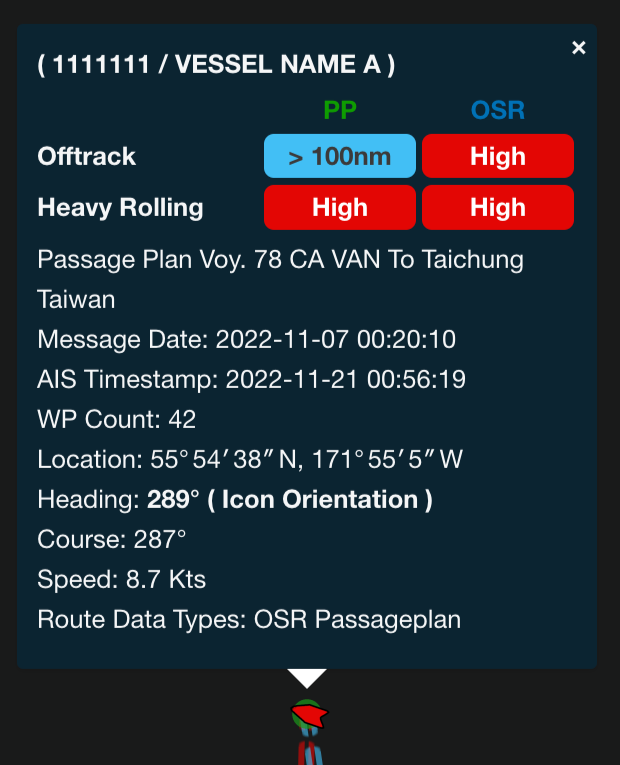 |
| Offtrack | Distance (Vessel - Route deviation) |  |
| Grounding Int | Alert Type: Grounding Intersection Simulation Time (Alert update time) Location (Intersection coordinates) Time to intersection (from simulation time) Distance At Simulation Time Speed At Simulation Time |
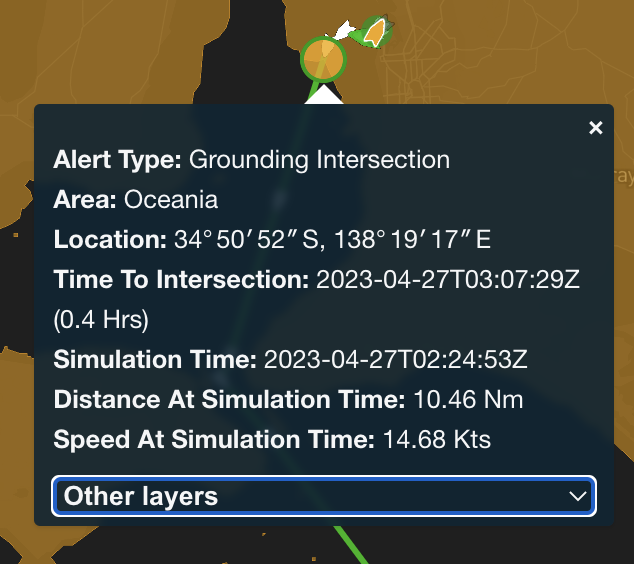 |
| NAVAREA Int | Alert Type: NAVAREA Intersection Area (NAVAREA category) Risk Name (NAVAREA name) Simulation Time (Alert update time) Location (Intersection coordinates) Time to intersection (from simulation time) Distance At Simulation Time Speed At Simulation Time (Vessel speed at simulation time) |
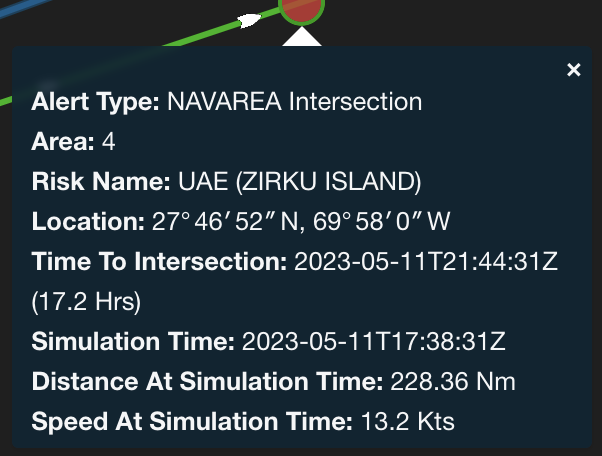 |
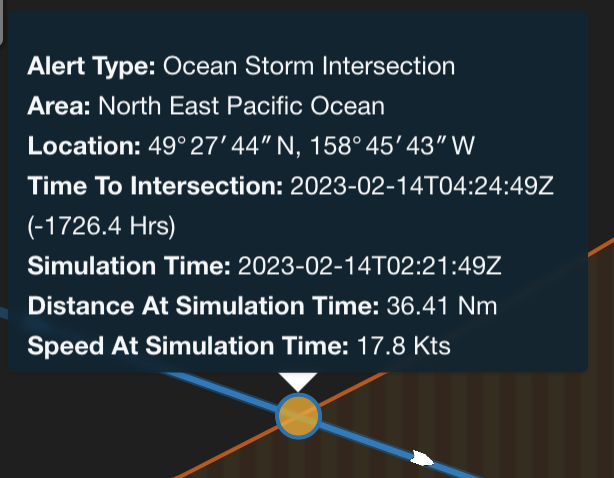
| Ocean Storm Int | Alert Type: Ocean Storm Intersection Simulation Time (Alert update time) Location (Intersection coordinates) Time to intersection (from simulation time) Distance At Simulation Time Speed At Simulation Time (Vessel speed at simulation time) |
 |
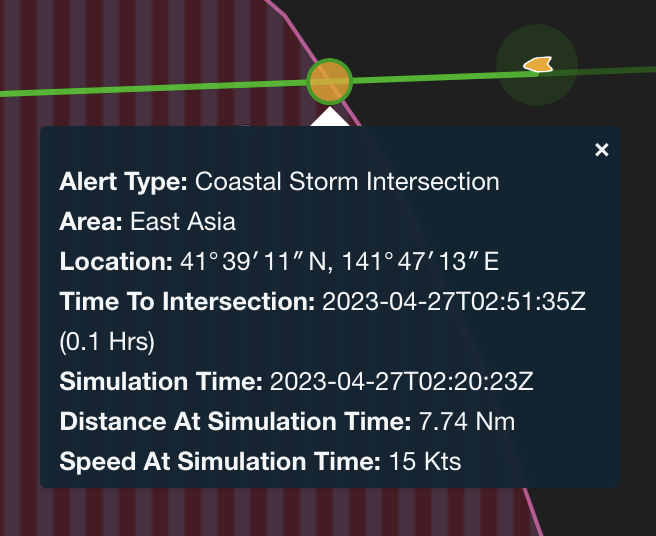
| Coastal Storm Int | Alert Type: Coastal Storm Intersection Simulation Time Alert update time Location (Intersection coordinates) Time to intersection (from simulation time) Distance At Simulation Time Speed At Simulation Time (Vessel speed at simulation time) |
 |
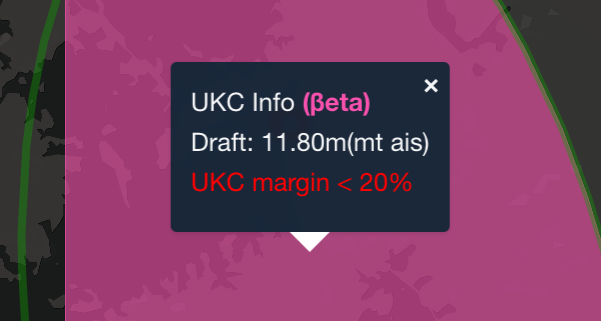
| UKC Info (βeta) | UKC Info (βeta) Draft (Vessel-reported draft) UKC margin (as a percentage of draft) |
 |
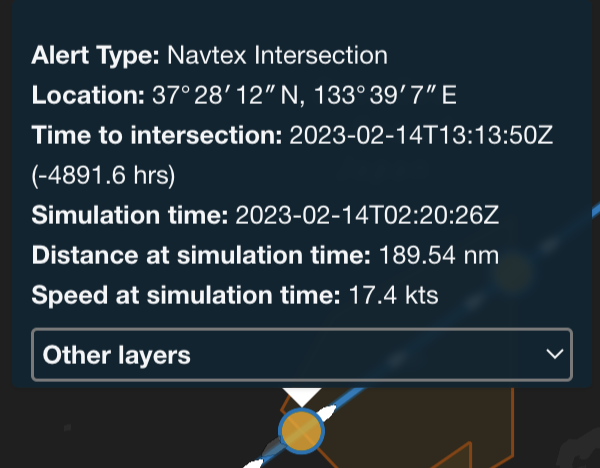
| NAVTEX Int | Alert Type: NAVTEX Intersection Location (Intersection coordinates) Time to intersection (from simulation time) Simulation Time (Alert update time) Distance At Simulation Time Speed At Simulation Time (Vessel speed at simulation time) |
 |
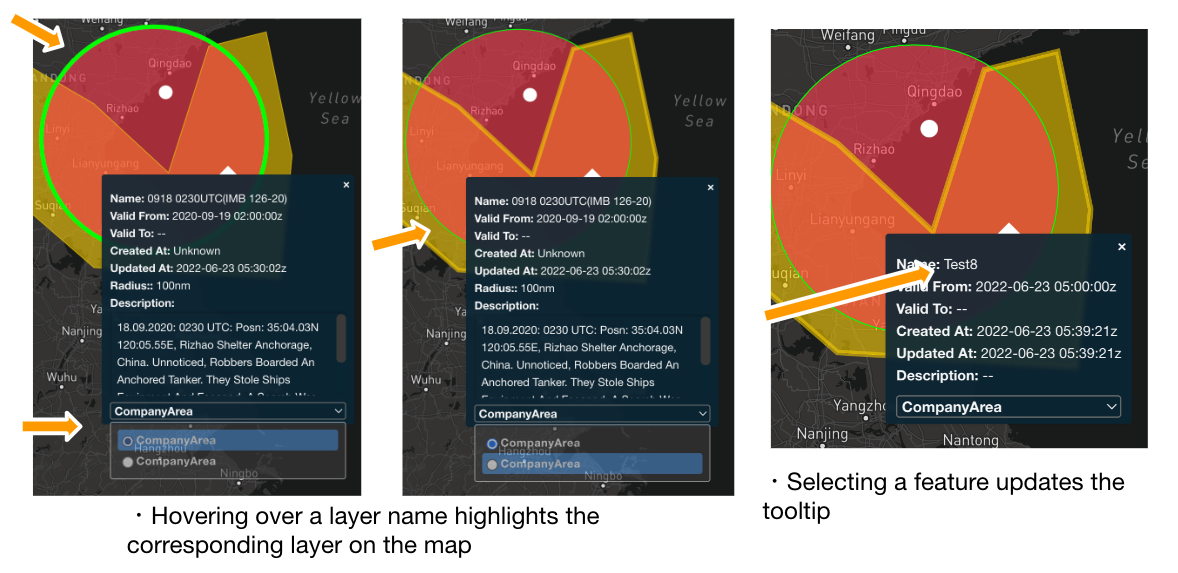
Layer tooltip
The layer tooltip is displayed when hovering over or tapping a feature on the map. If multiple features are in the same area, a feature selector is displayed at the bottom of the tooltip. Moving the mouse over an item in the list highlights the feature on the map (See image below).
Display layer details
Mouse over to view detailed information about the following layers.
| Item | Description | Sample |
|---|---|---|
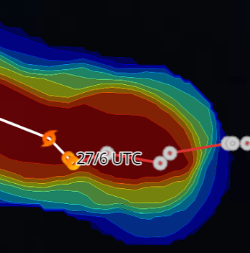
| Cyclone | Cyclone name - Forecast time of passage Class: Location: Forecast location Heading Gusts Pressure Speed: Forecast travel speed 10min Max WS |
 |
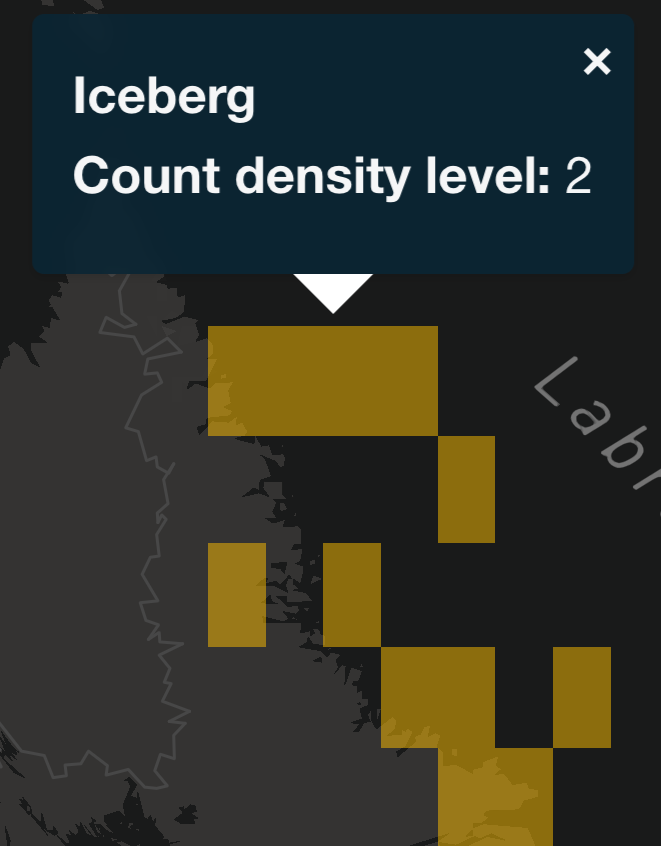
| Iceberg | Iceberg Count density level |
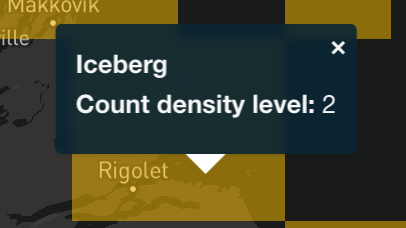 |
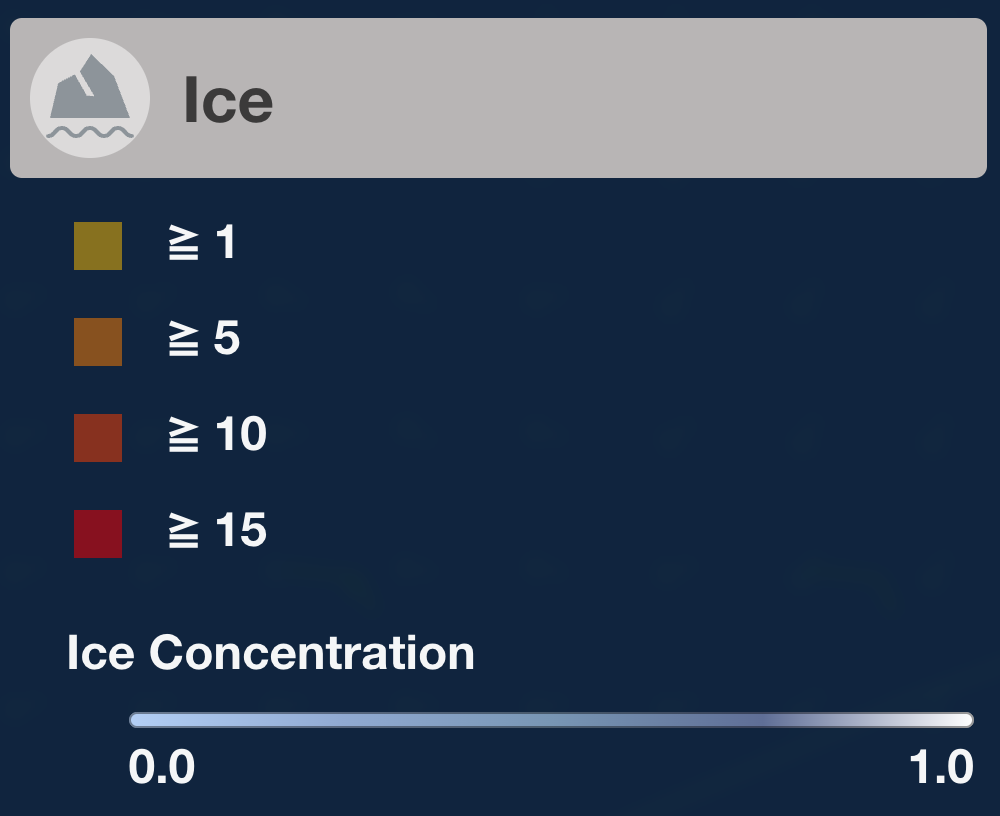
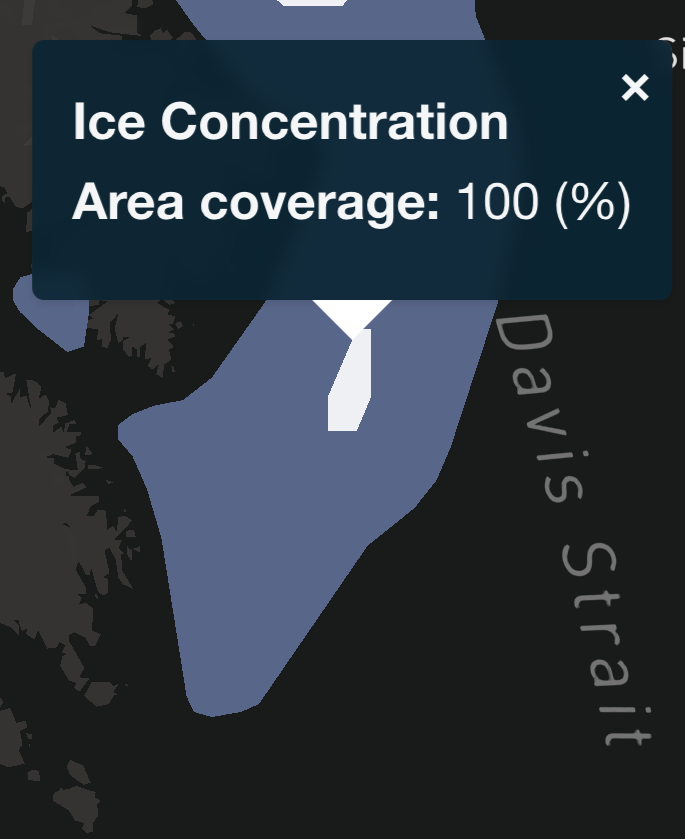
| Ice | Ice Concentration Area coverage: Sea Ice Concentration(%) |
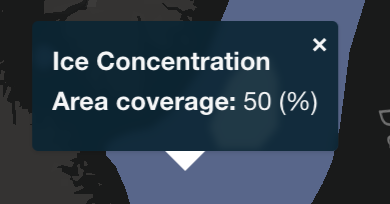 |
| Ocean | Area: Ocean Storm area Start date: Forecast start date End date: Forecast end date Location: Storm area Description: Storm details |
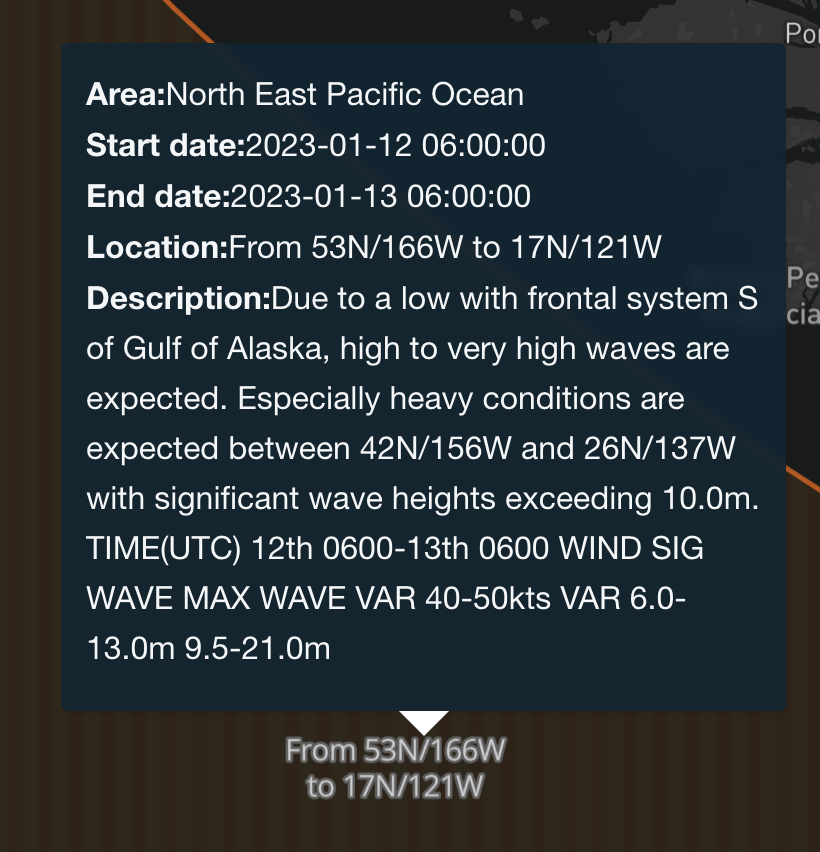 |
| Coastal | Area: Coastal Storm area Start date: Forecast start date End date: Forecast end date Location: Storm area Description: Storm details |
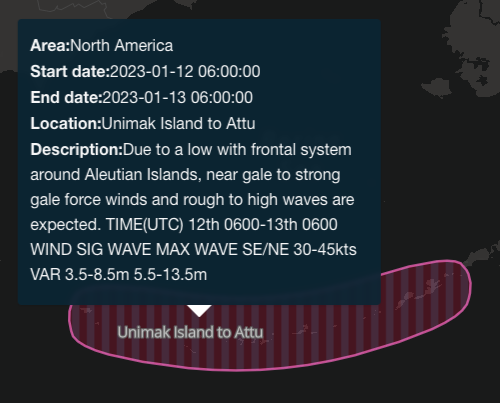 |
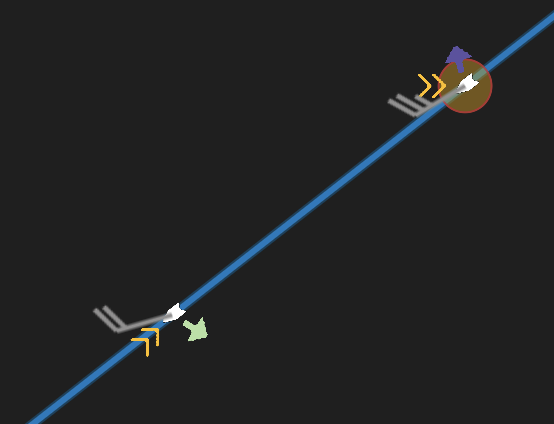
| Wind | Direction / Speed |  |
| NAVAREA | Area info NAVAREA (No.) Area category Warning period Warning info Risk level Details |
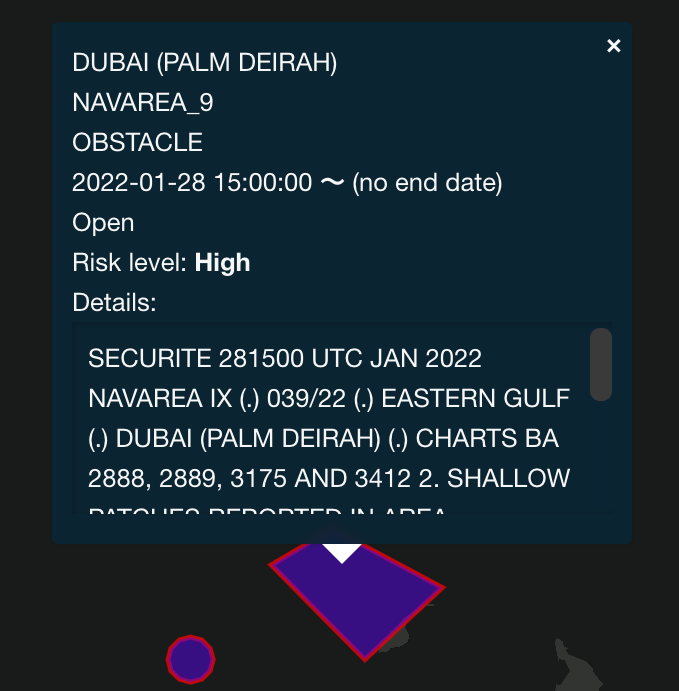 |
| UKC Detail | UKC Detail (0.05G rid) Depth (below sea level) Draft: Vessel draft |
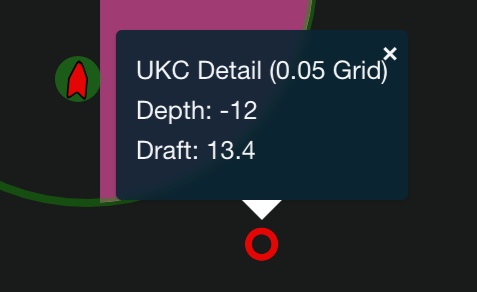 |
| Company Area | Name: Item name Valid From: Start date Valid To: End date / -- (if no end date) Created At: Item generation date Updated At: Item update date Description: Item description / -- (if no description) |
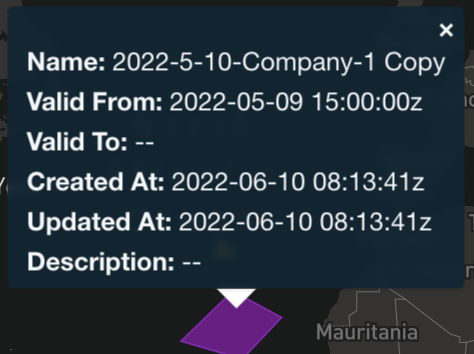 |
| Navtex Area | [NAVTEX Navigational Warnings] {Area name} Description: Item description / -- (if no description) |
 |
| Piracy | Piracy Location: Latitude, Longitude (DMS) Incident Time: The time the event occurred Area: Region name Ship Type: Ship type Attack Type: Attack type (e.g. Boarded, Stolen) Source: Information source Description: Incident details / -- (if no details) |
 |
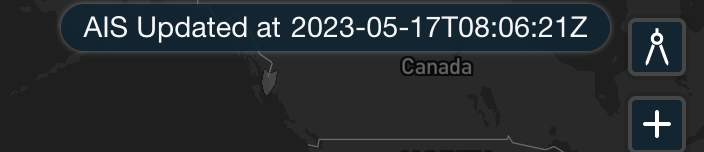
AIS updates
AIS data is updated every three minutes with the latest AIS data.
The latest update time is displayed in the upper-right of the screen.
Pre-update
Post-update
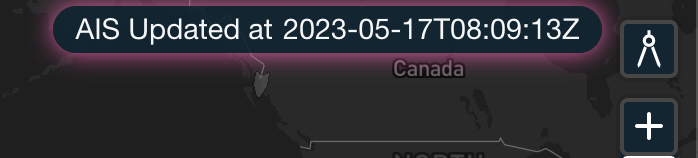
The AIS timestamps are updated in the Monitoring List, as well.
Settings preservation
The last-used settings are restored when re-opening the site if using the same browser.
Note
If opening the site from the Daily Summary Mail for a specific Alert Type, the selected Alert Type and related layers are used, in addition to saved settings. The alert type is set to the Daily Summary Mail alert type.
The following settings are saved:
- Selected layers (from the left-side layer menu)
- Selected Alert types
- Selected Route types
- Selected Passageplan Status types (in the Monitoring List dropdown)
- Monitoring list height
- Monitoring list Lat / Lon isDMS setting
- Selected Theme
- Selected Basemap
- Selected Risk Levels (the red, yellow, and gray buttons on the left)
- Rolling Rose setting (rolling / weather)
- Time Controller settings
- Minimized status
- "by Point" checkbox
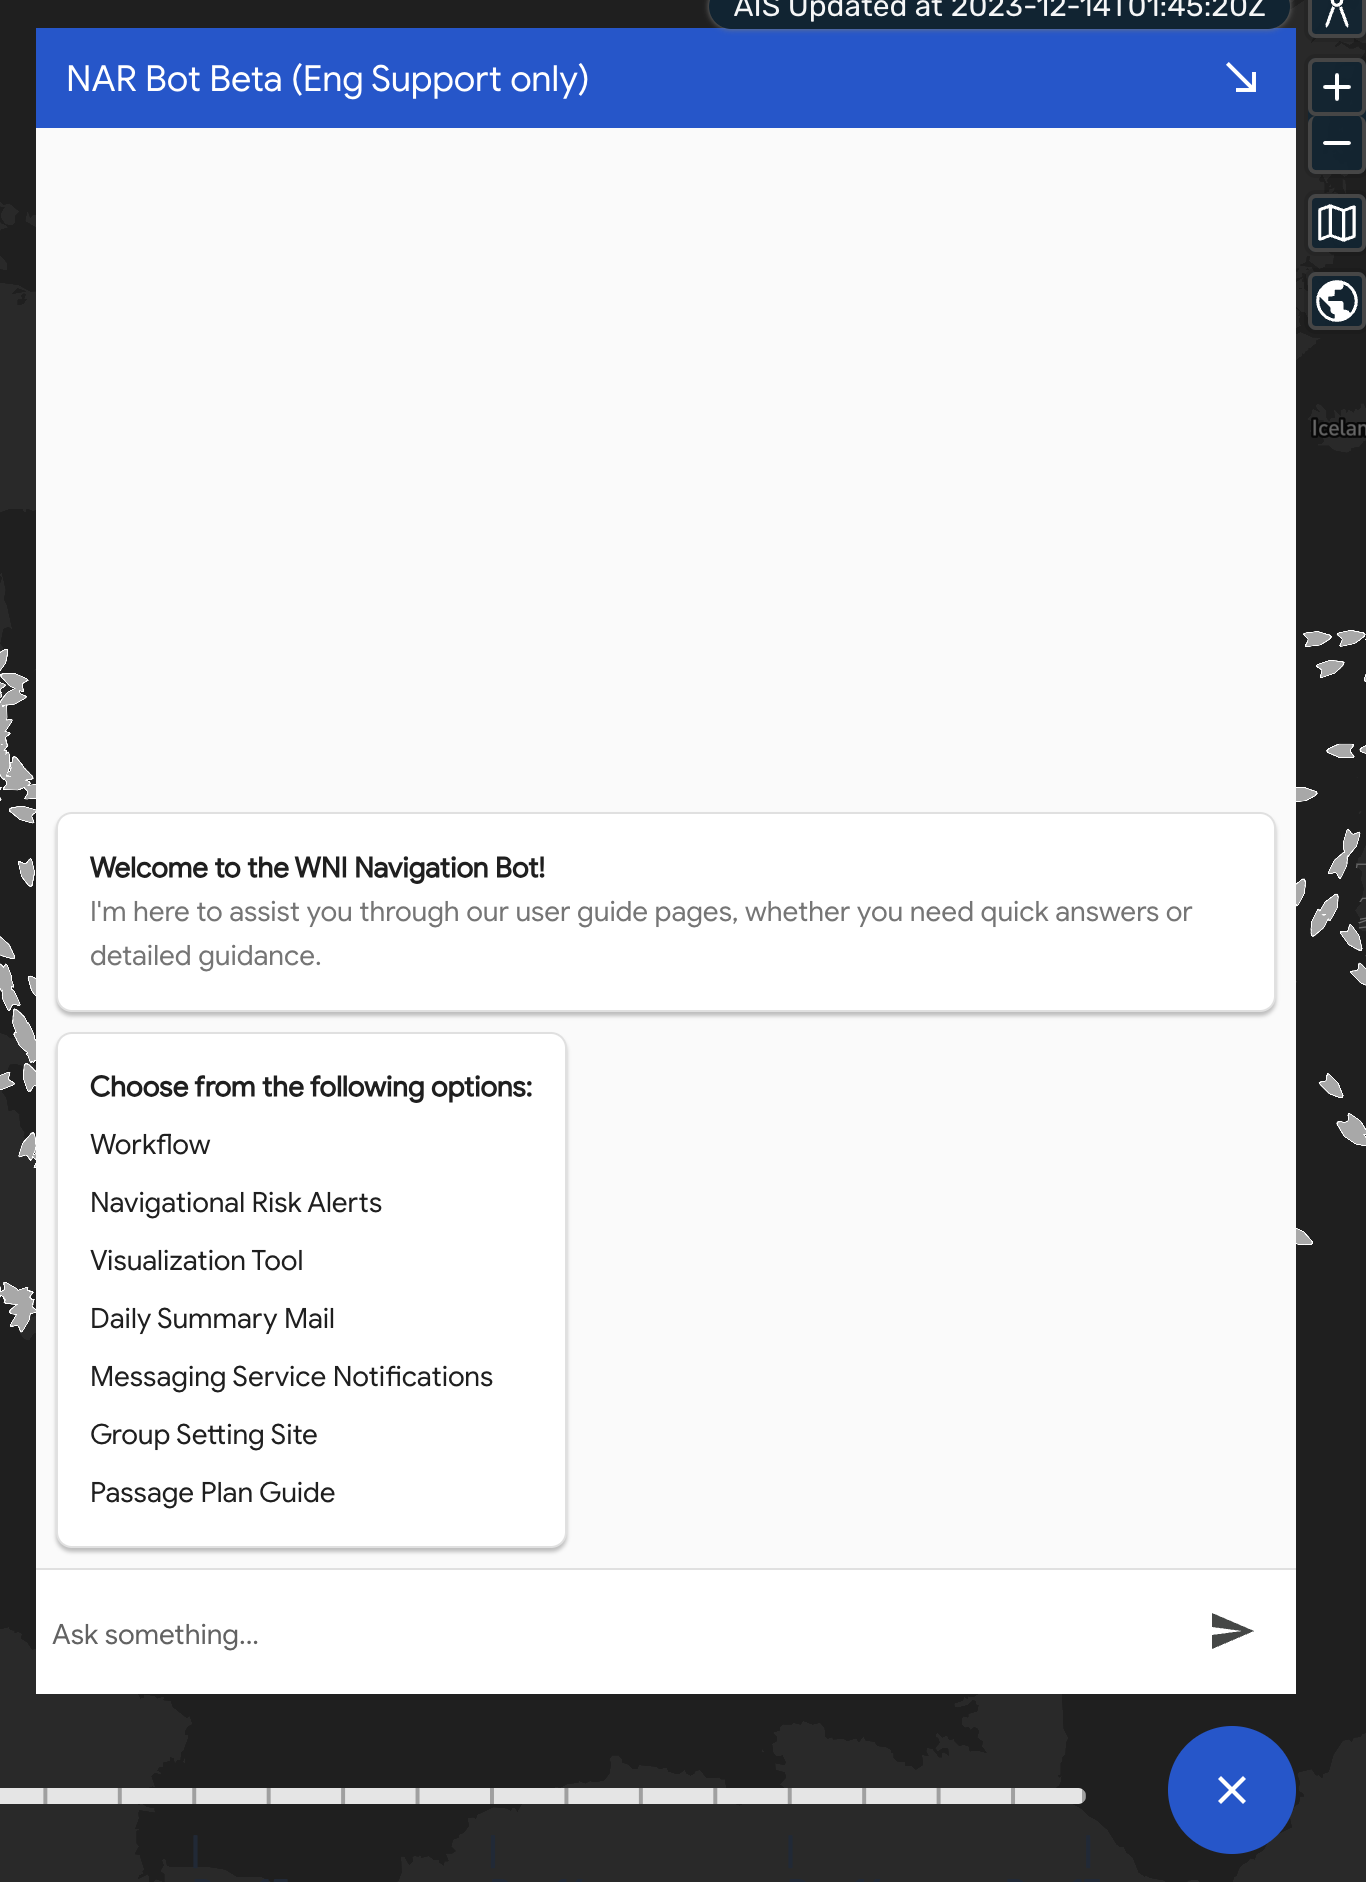
NAR Chatbot beta
Note
This feature is still in beta. We welcome your feedback.
The NAR Chatbot provides a new way to answer your queries about NAR. The current beta version uses a keyword-based approach to generate answers, and is available in English only. If you cannot get the answer you intended, please ask the question with simple keywords.